


7.1 Saltmarsh signs – wasteland to wonderland
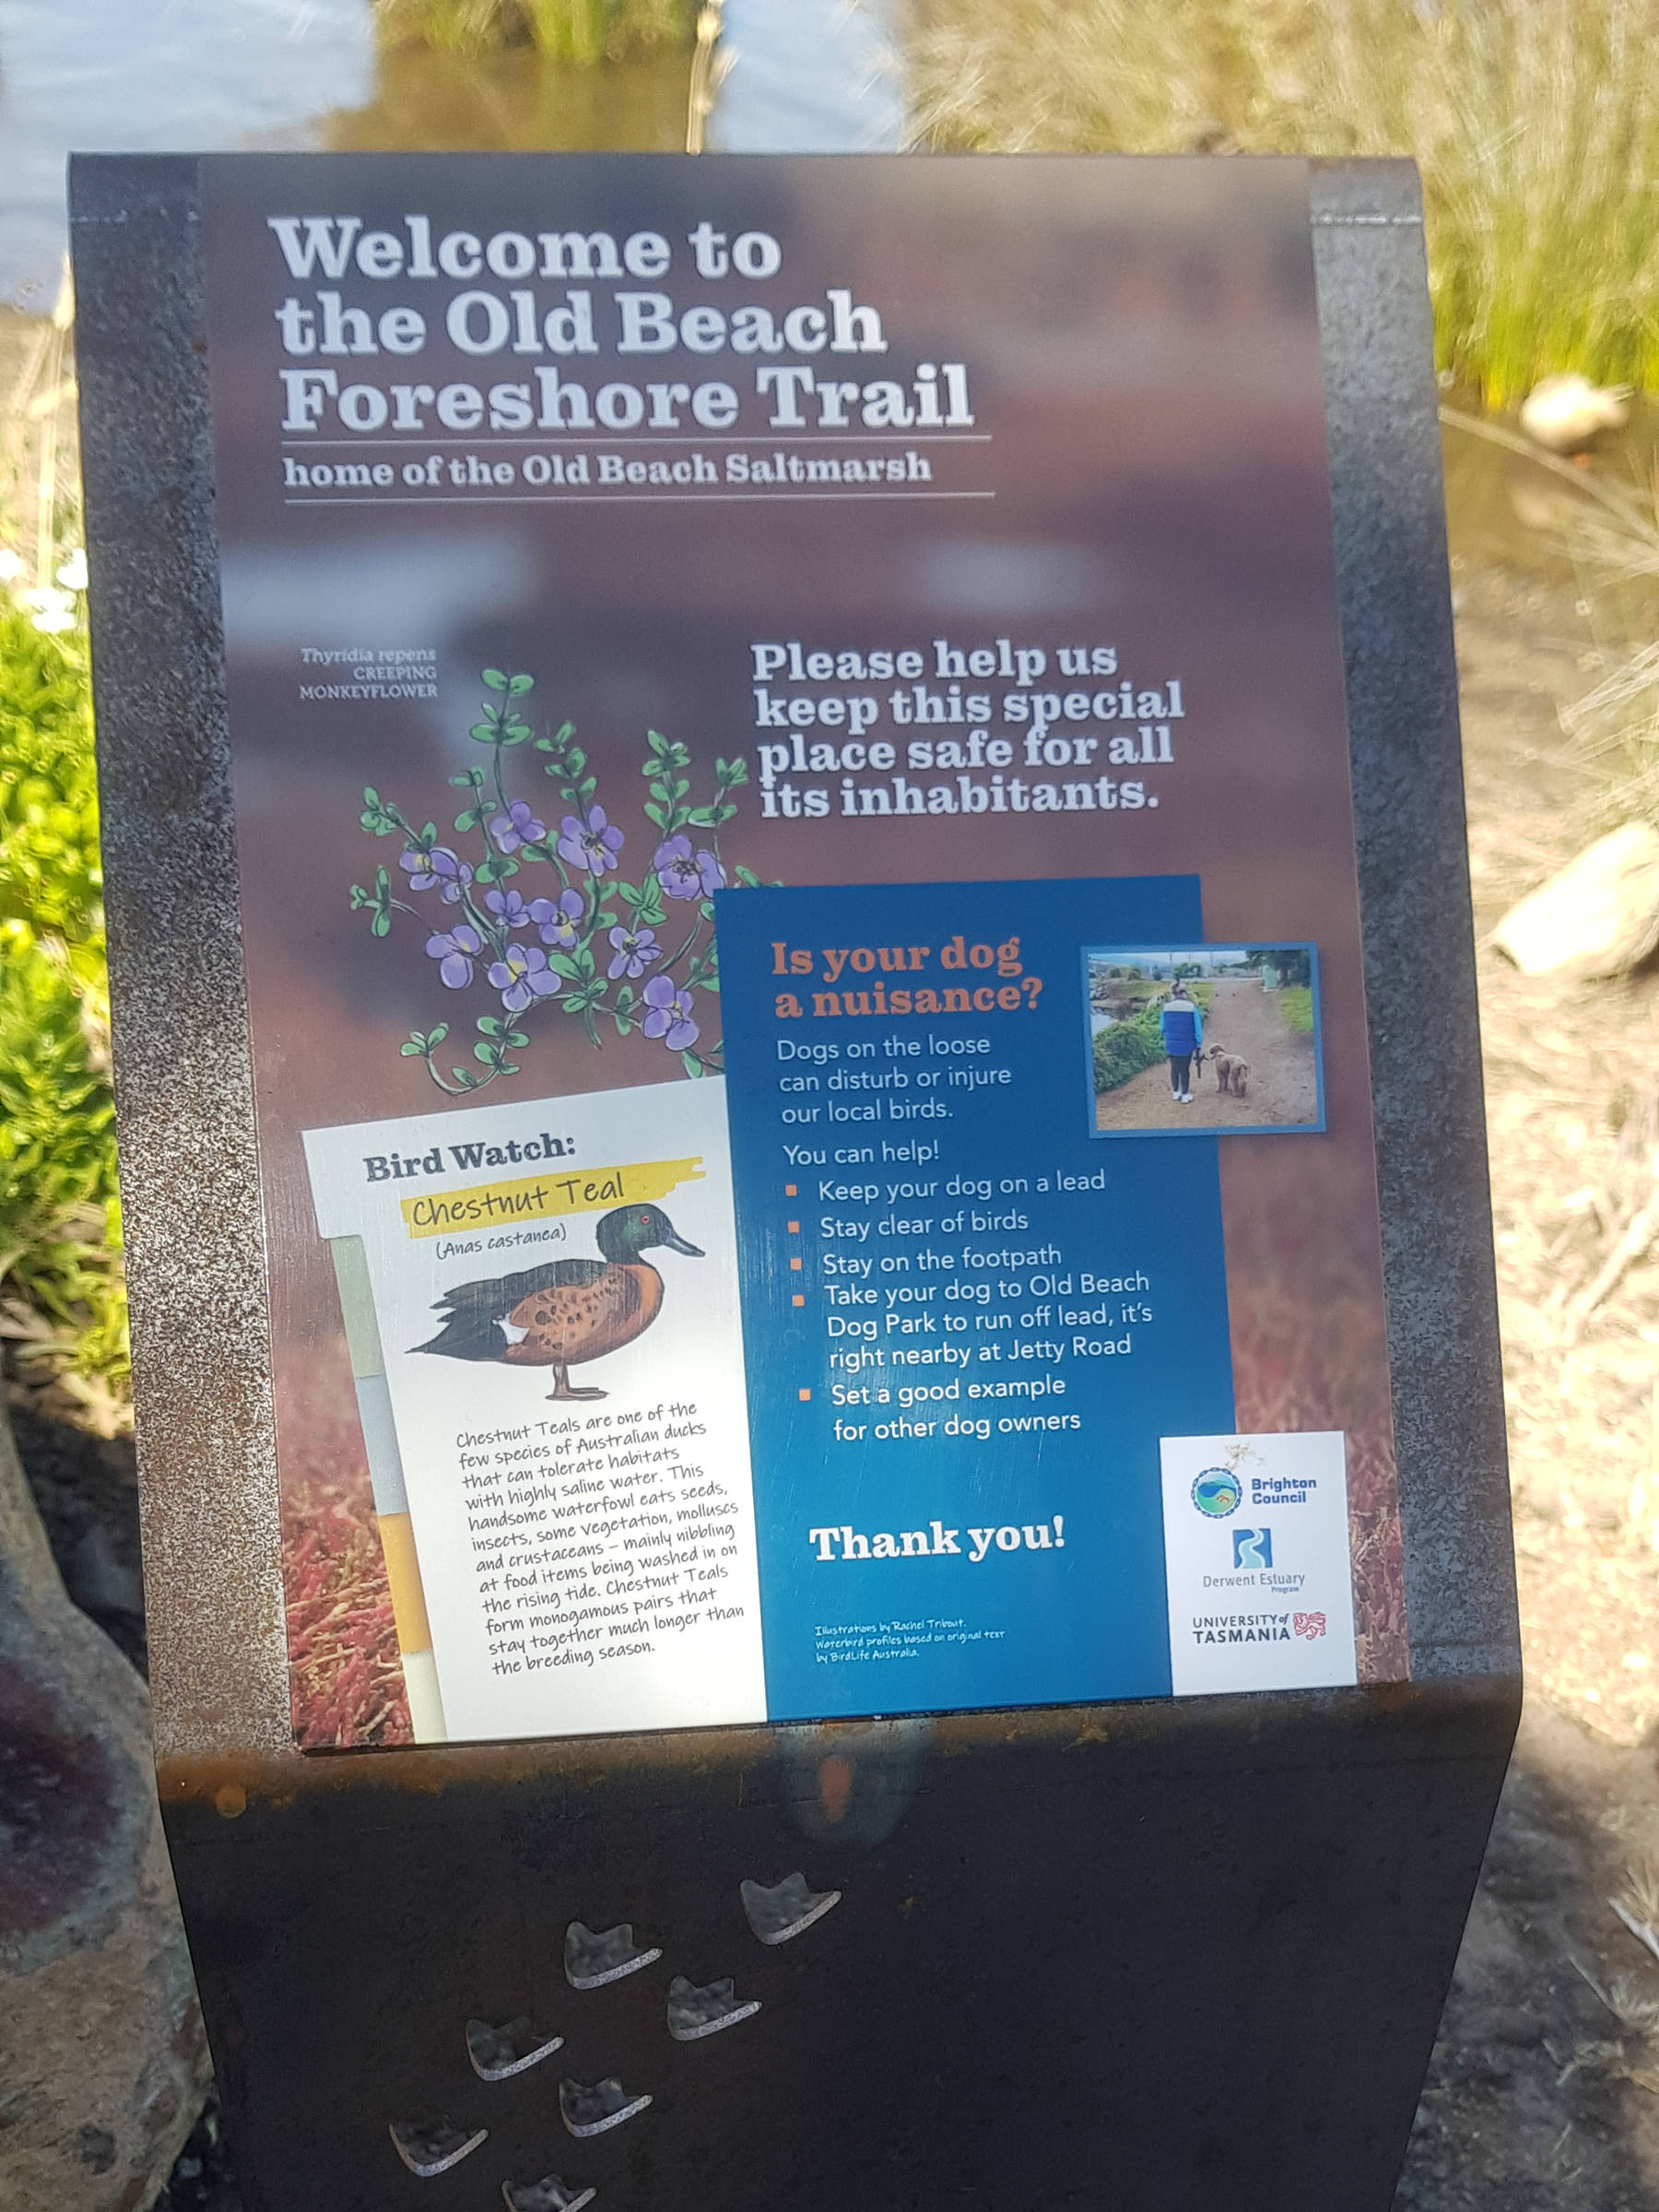
Old Beach Foreshore Trail signage.
Image: Derwent Estuary Program
Brighton Council in partnership with the Derwent Estuary Program and UTAS installed a suite of informative signs along the Old Beach Foreshore Trail as part of a community event in the summer of 2022.
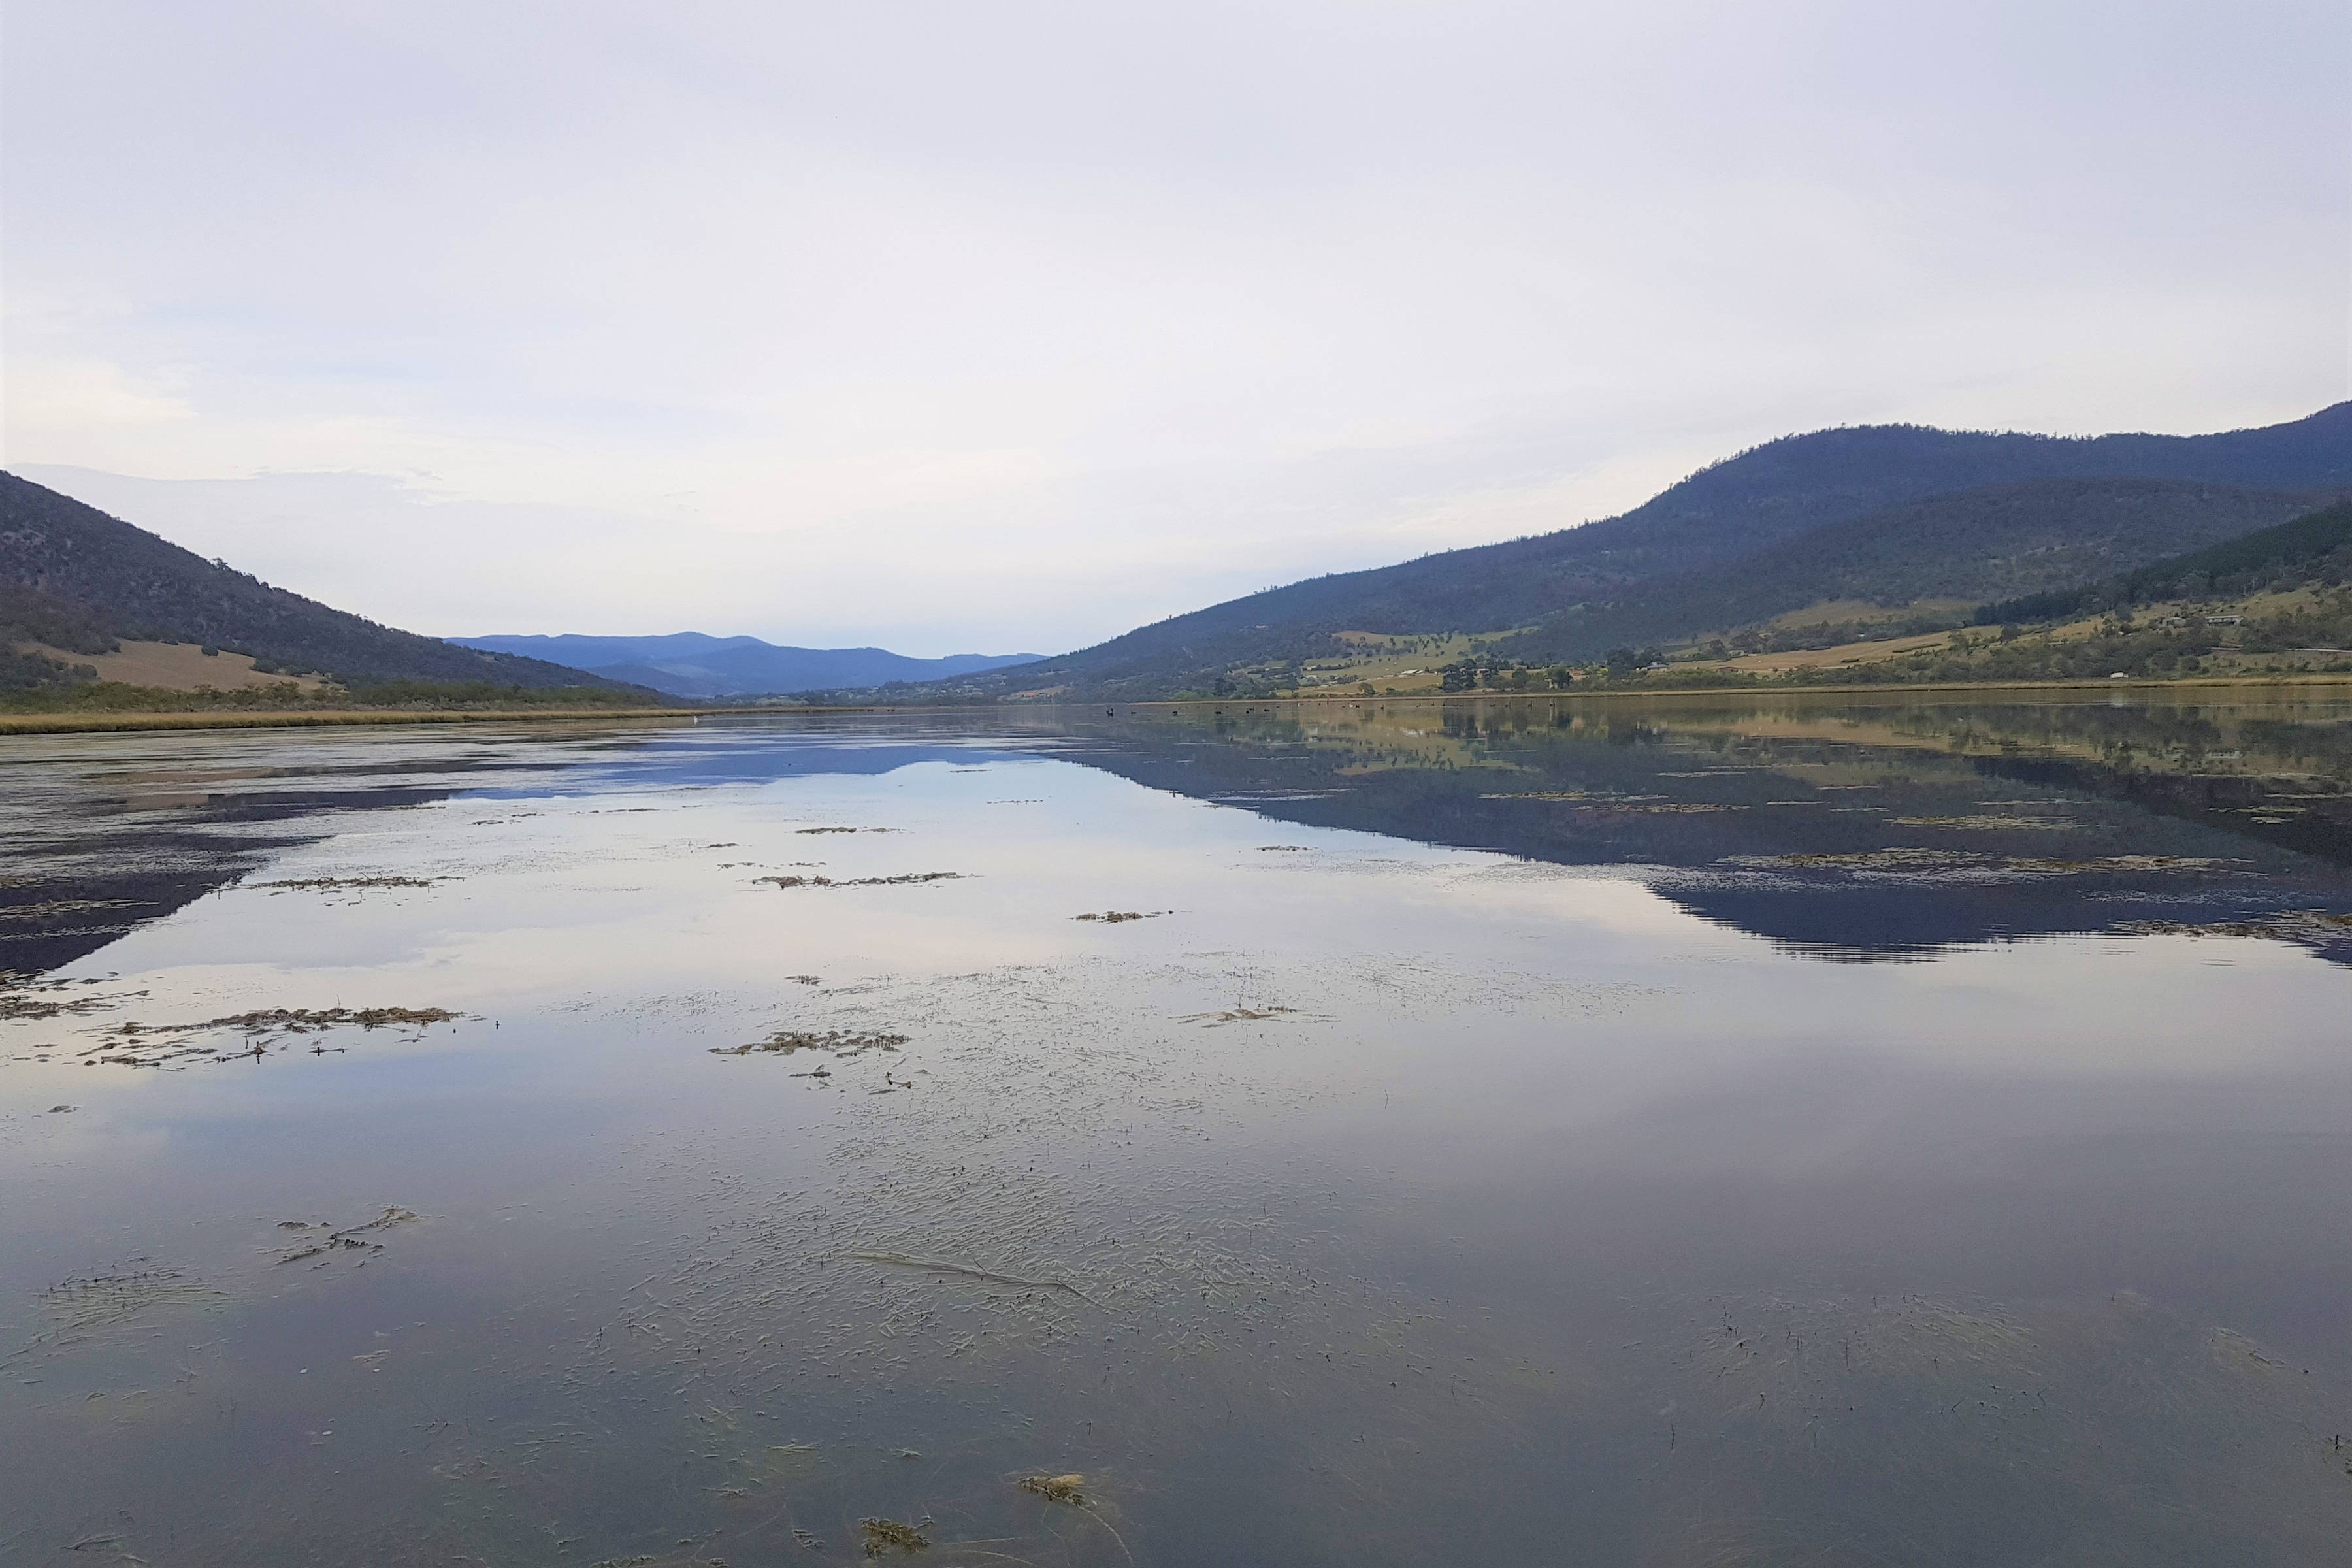
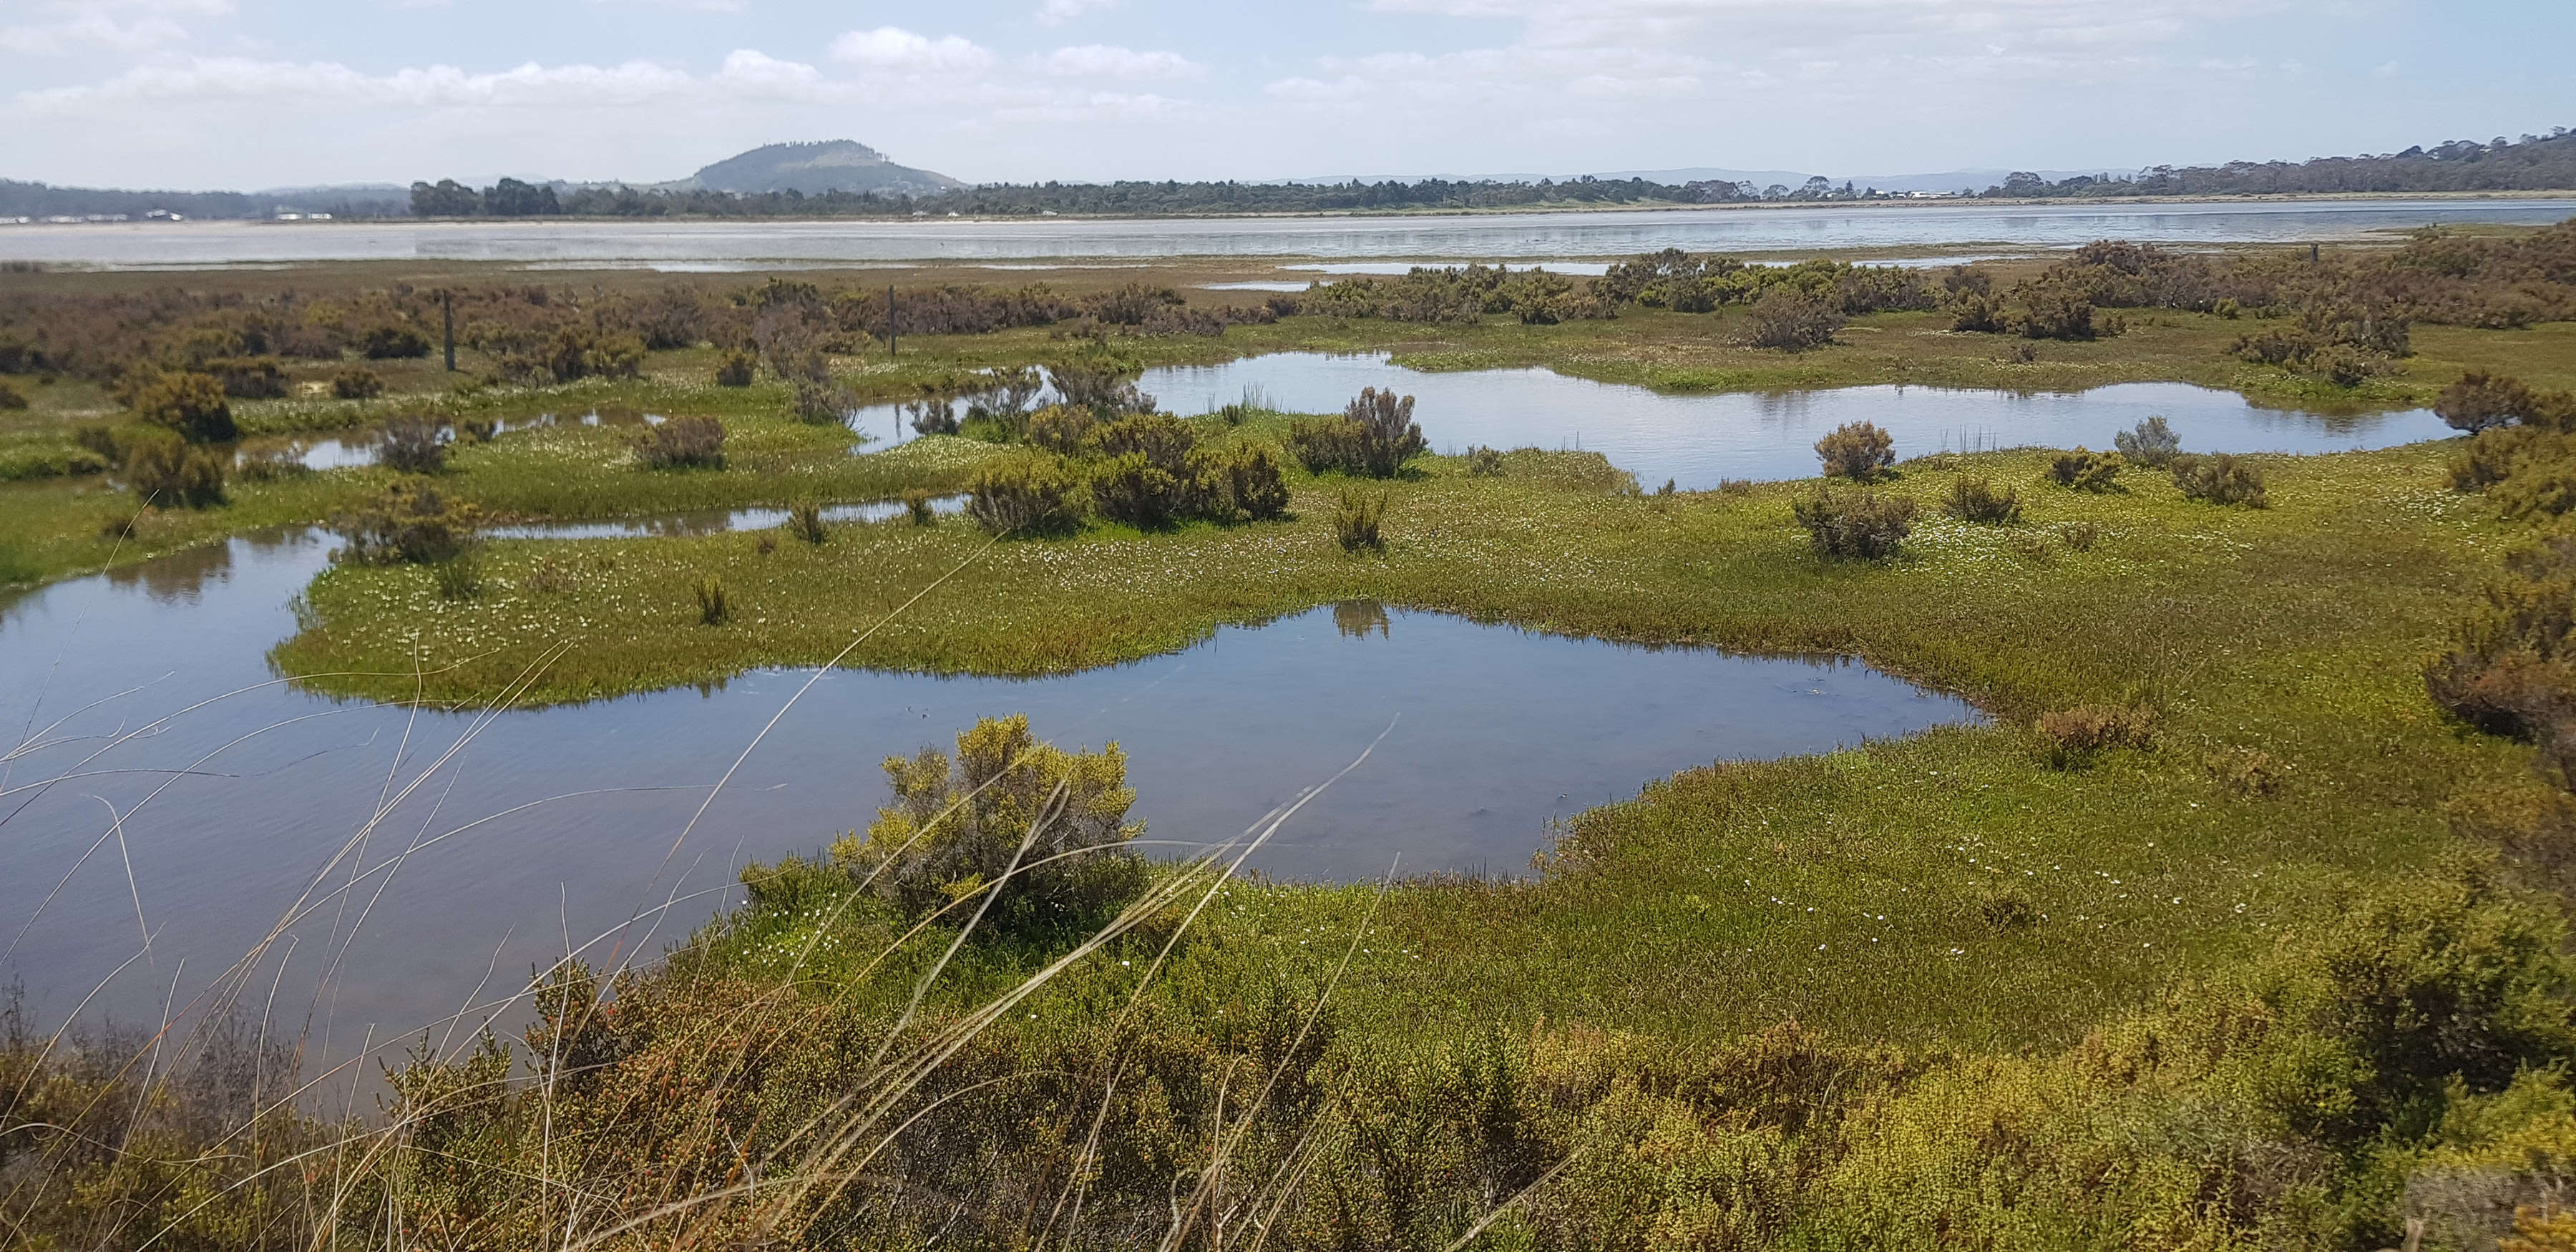
The saltmarshes, and Derwent River foreshore are an extremely valuable natural asset within the Brighton Municipality and provide a great place for connecting with nature to learn about the many ways they benefit our wellbeing.
Saltmarsh is not only beautiful, it plays an important role in filtering water to keep it clean, it’s a place for fish and birds to breed and we now know it is very efficient at capturing carbon. Recently we surveyed 15 saltmarsh sites across the estuary to assess condition and recommend management options, including at Old Beach.
We are delighted to support Brighton Council in their efforts to look after this excellent area of saltmarsh. Once viewed as muddy wastelands, the new signs highlight how valuable saltmarsh is so we can instead celebrate this unique habitat and landscape.
We are lucky here in the Derwent to still have these remnant patches of nature in the midst of suburbia, such as the Old Beach Saltmarsh. We will do well to look after this special place and let it look after us in turn.