Introduction to the estuary, its management and monitoring

The Derwent estuary lies at the heart of the Hobart metropolitan area and was a major route for palawa/pakana people between the coast and-hinterland for around 40,000 years. The Derwent is also a waterway of great natural beauty and diversity. It is an integral part of Tasmania’s cultural, economic and natural heritage as well as an important and productive ecosystem that supports a wide range of habitats and species.

Introduction

The Tasmanian Aboriginal Centre’s (TAC) Language Program has undertaken both linguistics and historical research on the original languages of Tasmania to retrieve and revive Aboriginal language in Tasmania — palawa kani. The name of the River Derwent in palawa kani, is timtumili minanya. Previously, the Aboriginal names for the River Derwent came from G.A. Robinson’s records from the 1830s, where he attempted to give his idea of their sound by dividing words into syllables. The names for the Derwent were noted as: TEETOOMELE MENENNYE, RAY. GHE.PY.ER.REN.NE and NIB.BER.LIN.

Today, approximately 40% of Tasmania’s population — 227,000 people — live around the estuary’s margins. The Derwent is widely used for swimming, boating, fishing, marine transport and industry. Further upstream, the River Derwent supplies about 60% the region’s drinking water and is a major source of hydroelectric power.

A number of environmental issues affect the Derwent estuary, in particular:

  • heavy metal contamination
  • poor recreational water quality at some bays and beaches
  • low oxygen levels in the upper estuary during summer
  • elevated nutrient concentrations
  • environmental flows and barriers
  • introduced marine pests and weeds
  • loss of habitats and species
  • impacts of climate change, e.g. sea level rise, erosion and habitat loss

Although there have been significant improvements in the treatment of sewage and industrial wastes over the past decade, the Derwent still faces a number of environmental challenges. A strategic and coordinated planning approach across all levels of government, industry and the community is our best hope for a clean and healthy estuary in the future.

Moody estuary. Image: Peter Mathew / TasWater.

Image: Peter Mathew / TasWater

Management and restoration

The Derwent Estuary Program (DEP) was established in 1999 as a partnership to share science for the benefit of the community, nature and the economy. The program has been successful in bringing together a wide range of stakeholders — firstly to build a common understanding, vision and management framework — and secondly to progressively implement this vision through partnership agreements and practical actions.

The program was initially designed to address environmental quality issues such as industrial and urban water pollution, contaminated sediments, invasive species and loss of estuarine ecosystems. More recently, our scope has broadened to include the catchment and channel influences, as well as education and amenity. Key program areas include environmental monitoring and reporting, coordination of regional activities, stormwater management, heavy metal investigations, wetland, saltmarsh and seagrass restoration, and promotion of walking tracks.

Our program partners

The DEP, a not-for-profit company limited by guarantee, is supported by the Tasmanian Government, six councils that border on the estuary (Brighton, Clarence, Derwent Valley, Glenorchy, Hobart and Kingborough Councils), five business partners (Nyrstar Hobart, Norske Skog Boyer, TasWater, TasPorts and Hydro Tasmania) and research partner Institute for Marine and Antarctic Studies, University of Tasmania. Other project supporters include the CSIRO and NRM South.

Water quality monitoring. Image: Peter Mathew / TasWater.
Water quality monitoring.

Image: Peter Mathew / TasWater

Tasman Bridge, Hobart.

Image: Derwent Estuary Program

Environmental monitoring and reporting

A fundamental requirement for effective natural resource management is an on-going and reliable source of environmental data. This principle forms the basis of the DEP’s cooperative monitoring program between the state government, councils, industries and research institutes. Formerly independent monitoring programs are now coordinated so as to provide better information on the estuary as a whole, and to report annually on environmental conditions and trends in the Derwent.

This ‘Report Card’ summarises monitoring data collected by the DEP and our partners, as well as other relevant information collected during 2020 and early 2021, including:

  • weekly recreational water quality testing during summer months
  • monthly whole-of-estuary water quality monitoring
  • surveys of heavy metal levels in fish and shellfish
  • biological surveys (rocky reefs, spotted handfish, little penguins)
  • weed surveys and control actions (rice grass, karamu)

More detailed information is published in five-yearly State of the Derwent Estuary reports, available on our website.

View of Hobart city from kunanyi / Mount Wellington.

Image: Tourism Tasmania / Rob Burnett

Derwent estuary catchment zones

From the river to the sea the River Derwent and estuary supports a variety of habitats, species and human uses which are depicted in the following five illustrations. Environmental inputs that affect these areas are also highlighted.

Pollution sources, loads and trends

Pollutants of particular concern in the Derwent estuary include:

  • heavy metals, as these may be toxic to aquatic plants and animals and accumulate in seafood — a potential health risk for local anglers.
  • excessive nutrients, as these can trigger algal blooms that reduce water clarity, smother fish habitat and deplete oxygen. Low oxygen may result in fish kills, rotten egg odours and release of nutrients and heavy metals from sediments.
  • pathogens from human sewage that are a human health risk
  • sediments, as these reduce light available to aquatic plants
  • litter — particularly floating plastics

Pollution sources

Pollution enters the Derwent estuary from many sources, commonly referred to as ‘point sources’ and ‘diffuse sources’.

Point sources include sewage treatment plants and large industries, such as the Norske Skog paper mill at Boyer and Nyrstar Hobart zinc smelter at Lutana.

Diffuse sources include stormwater runoff from urban areas as well as the larger catchment inputs carried by the Derwent and Jordan rivers. Other diffuse pollutant sources include air pollution, landfills, aquaculture operations, and wastes associated with ports and marinas. Sediments within the estuary itself may also release pollutants into the overlying waters under certain conditions.

Industry

Industries have historically been the main source of heavy metal pollution to the Derwent, however loads have declined significantly in recent years.

Contaminated groundwater at Nyrstar is now the largest remaining source, and is being captured and treated using a series of innovative projects. In 2020, over 80 tonnes of zinc and other metals were captured. Elevated recovery of zinc in 2016 was a result of higher flows and a greater volume processed.

Groundwater metals recovery (tonnes)
160 140 120 100 80 60 40 20 0 Tonnes 2016 2017 2018 2019 2020 Zinc 148.9 Cadmium 3.0 Zinc 84.6 Cadmium 2.5 Zinc 85.4 Cadmium 2.3 Zinc 82.8 Cadmium 2 Zinc 84.1 Cadmium 1.7 Cadmium Zinc
  2016 2017 2018 2019 2020
Cadmium 3 2.5 2.3 2 1.7
Zinc 148.9 84.6 85.4 82.8 84.1

Sewage

Sewage treatment plants are the largest source of bioavailable nutrients, followed by the catchment, stormwater and the Norske Skog paper mill.

Effluent reuse turns a waste product into valuable, nutrient-enriched irrigation water, removing nutrients that would otherwise enter the Derwent estuary. In 2020, the volume of sewage effluent reused was similar to the previous year and accounts for approximately 20% of the regional sewage generated.

Sewage effluent re-use (megalitres)
4000 3500 3000 2500 2000 1500 1000 500 0 Megalitres 2016 2017 2018 2019 2020 Bridgewater 537.612432 Cameron Bay 31.67333334 Rokeby 762.8916 Rosny 1540.692021 Selfs Point 104.9491667 Bridgewater 759.177 Cameron Bay 93.73068966 Rokeby 730.79 Rosny 1225.414 Bridgewater 668.024 Cameron Bay 117.798 Rokeby 766.29 Rosny 1489.343 Selfs Point 12 Bridgewater 790.373 Cameron Bay 121.404 Rokeby 821.501 Rosny 1623.25 Selfs Point 24 Bridgewater 622.949 Cameron Bay 84.382 Rokeby 855.5057042 Rosny 1305.063 Selfs Point 24 Selfs Point Rosny Rokeby Cameron Bay Bridgewater
  2016 2017 2018 2019 2020
Bridge­water 537.612 759.177 668.024 790.373 622.949
Came­ron Bay 31.673 93.731 117.798 121.404 84.382
Rokeby 762.892 730.79 766.29 821.501 855.506
Rosny 1540.692 1225.414 1489.343 1623.25 1305.063
Selfs Point 104.949   12 24 24

Pathogens

Pathogens — usually measured indirectly using faecal indicator bacteria — can be derived from overflows or leaks from the sewerage network, as well as animal faeces associated with stormwater and rural run-off. Urban stormwater accounts for most of the sediment and litter that enters the Derwent, with unmanaged erosion from construction sites a particular concern.

Catchment

Our understanding of river water quality will be boosted with a three-year trial of real-time water quality analysers in the River Derwent. Funding from The Ian Potter Foundation will allow us to install real-time water quality analysers in six locations across the catchment.

The new analyser technology was originally developed by Prof. Michael Breadmore’s team at the University of Tasmania and engineered for commercialisation by Eco Detection and Grey Innovation. The new analyser technology will measure nutrients as they have the potential to cause undesirable excessive algal growth including toxic algal blooms.

The analysers work in near real-time, meaning they take measurements every 4–6 hours automatically. Data is instantly sent to the internet Cloud where it can be accessed from anywhere, anytime on mobile devices or computers to enable fast and improved decision making.

The first analyser was installed late 2021 at the Turriff Lodge Wastewater Treatment Plant, operated by TasWater. The remaining five analysers will be installed early in 2022. Data summaries will be provided in the 2022 Report Card.

River water quality

The River Derwent is a significant source of contaminants to the estuary. Early warning signs of nutrient stress including growth of benthic blue-green algae leading to taste and odour issues in Hobart’s main water supply as well as filamentous algal blooms smothering valuable macrophyte communities have raised concerns about the water quality of the River Derwent catchment upstream of New Norfolk.

River Derwent loads are presented to provide an indicative value of the contribution of contaminant loads to the estuary from the catchment (above Meadowbank). Loads were calculated by multiplying the ambient water quality concentration data collected from surface waters at New Norfolk (monthly observation) by the total monthly flow (gigalitres) at New Norfolk to give a load in t/month and t/year. Loads are based off one monthly observation, and therefore should be viewed as indicative only, and are employed for general contextualisation. For this reason, no statistical analysis has been conducted on this dataset. Only data since 2007 has been presented because this is when monthly sampling began at New Norfolk.

In general, loads have been highly variable across years. High loads in 2013 and 2016 were driven by high winter rainfall and consequently, above average river discharge volumes.

Nutrients including ammonia and ammonium, nitrite and nitrate, dissolved reactive phosphorus as well as total suspended solids have been increasing in recent years, peaking in 2019 and declining in 2020. Total phosphorus is frequently detected below reporting limits and as a result, no increase in phosphorus loads have been observed.

Contaminant loads tend to match trends in annual river discharge. Better understanding of nutrient runoff during rainfall-runoff and low flow periods is needed with high frequency nutrient monitoring. This will be addressed through the real-time analyser project, funded by The Ian Potter Foundation (see Catchment section).

Estimated combined loads

Nutrients: dissolved inorganic nitrogen (tonnes/year)
800 700 600 500 400 300 200 100 0 Tonnes 2016 2017 2018 2019 2020 River 245 Stormwater 49 Sewage 376 Industry 32.5 River 102 Stormwater 49 Sewage 349 Industry 32 River 139 Stormwater 49 Sewage 355 Industry 28.8 River 162 Stormwater 49 Sewage 245 Industry 39.26 River 123 Stormwater 49 Sewage 303 Industry 31.7 Industry Sewage Stormwater River
  2016 2017 2018 2019 2020
River 245 102 139 162 123
Storm­water 49 49 49 49 49
Sewage 376 349 355 245 303
Indu­stry 32.5 32.0 28.8 39.26 31.07
Nutrients: total phosphorus (tonnes/year)
250 200 150 100 50 0 Tonnes 2016 2017 2018 2019 2020 River 54 Stormwater 30 Sewage 92 Industry 10.5 River 28 Stormwater 30 Sewage 81 Industry 12.6 River 32 Stormwater 30 Sewage 76 Industry 9.7 River 41 Stormwater 30 Sewage 56 Industry 13.32 River 28 Stormwater 30 Sewage 68.3 Industry 11.5 Industry Sewage Stormwater River
  2016 2017 2018 2019 2020
River 54 28 32 41 28
Storm­water 30 30 30 30 30
Sewage 92 81 76 56 68.3
Indu­stry 10.5 12.6 9.7 13.32 11.5
Zinc (tonnes/year)
160 140 120 100 80 60 40 20 0 Tonnes 2016 2017 2018 2019 2020 Nyrstar groundwater 120 Nyrstar operations 6.52 Stormwater 7 Sewage 1.2 Nyrstar groundwater 120 Nyrstar operations 0.9 Stormwater 7 Sewage 1.2 Nyrstar groundwater 120 Nyrstar operations 1.7 Stormwater 7 Sewage 1.2 Nyrstar groundwater 120 Nyrstar operations 2.04 Stormwater 7 Sewage 1.2 Nyrstar groundwater 120 Nyrstar operations 2.6 Stormwater 7 Sewage 1.2 Sewage Stormwater Nyrstar operations Nyrstar groundwater
  2016 2017 2018 2019 2020
Nyr­star ground­water 120 120 120 120 120
Nyr­star oper­ations 6.52 0.9 1.7 2.04 2.6
Storm­water 7 7 7 7 7
Sewage 1.2 1.2 1.2 1.2 1.2
Sediments as total suspended solids (tonnes/year)
40,000 35,000 30,000 25,000 20,000 15,000 10,000 5,000 0 Tonnes 2016 2017 2018 2019 2020 River 26963 Stormwater 7996 Sewage 324.00541 Industry 935.6 River 9182 Stormwater 7,996 Sewage 201 Industry 809.8 River 19557 Stormwater 7996 Sewage 221 Industry 769.918596 River 27777 Stormwater 7,996 Sewage 175.9 Industry 684.3489693 River 10690 Stormwater 7996 Sewage 242.0157333 Industry 729.2225281 Industry Sewage Stormwater River
  2016 2017 2018 2019 2020
River 26963 9182 19557 27777 10690
Storm­water 7996 7996 7996 7996 7996
Sewage 324.00541 201 221 175.9 242.0157333
Indu­stry 935.6 809.8 769.918596 684.3489693 729.2225281
Organic matter as biochemical oxygen demand (tonnes/year)
1600 1400 1200 1000 800 600 400 200 0 Tonnes 2016 2017 2018 2019 2020 Sewage 590.93046 Norske Skog Boyer 852.6 Sewage 466.43457 Norske Skog Boyer 356.0 Sewage 481 Norske Skog Boyer 329.405988 Sewage 356.8 Norske Skog Boyer 358.58 Sewage 412.1 Norske Skog Boyer 350.02 Norske Skog Boyer Sewage
  2016 2017 2018 2019 2020
Sewage 590.93046 466.43457 481 356.8 412.1
Norske Skog Boyer 852.6 356.0 329.405988 358.58 350.02

Did you know?

New groundwater extraction bores at the zinc smelter will increase the amount of zinc remediated from this source and prevent it reaching the Derwent estuary.

The Derwent Estuary Program is a partnership between state and local government and industry to make the Derwent a world class asset by sharing science for the benefit of nature, the economy and the community.

Kelp forest.

Image: IMAS

Derwent water and sediment quality

The DEP ambient and recreational water quality monitoring programs have been operating for 19 years and provide a basis for assessments relating to swimming at beaches, and a whole of estuary health check. Current emphasis includes keeping tabs on dissolved oxygen levels and nutrients in the upper estuary.

Climatic conditions

Total rainfall in 2020 (656.2mm) was above average (612.2mm; all records since 1893) as recorded at the Bureau of Meteorology (BOM) weather station, Hobart (Ellerslie Road). All summer months (December–March) in the 2020–21 season experienced above average rainfall, except January 2021.

Rainfall at Ellerslie Road, Hobart, Bureau of Meteorology
125 100 75 50 25 0 Rainfall (mm) Month (July 2020 – June 2021) Jul Aug Sep Oct Nov Dec Jan Feb Mar Apr May Jun Jul 2020 11.6mm Jul 133 year average 51.8mm Aug 2020 103.8mm Aug 133 year average 54.2mm Sep 2020 35mm Sep 133 year average 52.8mm Oct 2020 122mm Oct 133 year average 61.9mm Nov 2020 12.2mm Nov 133 year average 54.1mm Dec 2020 72.2mm Dec 133 year average 56.3mm Jan 2021 28.9mm Jan 133 year average 46.9mm Feb 2021 52mm Feb 133 year average 39.4mm Mar 2021 59.6mm Mar 133 year average 44.7mm Apr 2021 23.8mm Apr 133 year average 50mm May 2021 12.6mm May 133 year average 47mm Jun 2021 59.8mm Jun 133 year average 53.8mm 2020/2021 rainfall 133 year average
Month 2020/2021 rainfall (mm) 133 year average (mm)
July 2020 11.6 51.8
August 2020 103.8 54.2
September 2020 35 52.8
October 2020 122 61.9
November 2020 12.2 54.1
December 2020 72.2 56.3
January 2021 28.9 46.9
February 2021 52 39.4
March 2021 59.6 44.7
April 2021 23.8 50
May 2021 12.6 47
June 2021 59.8 53.8
Giant kelp.
Giant kelp.

Image: IMAS

Fishing at Nutgrove Beach, Sandy Bay, Tasmania.

Image: Derwent Estuary Program

Male cow fish.
Male cow fish.

Image: IMAS

Swimming in the Derwent

Each summer recreational water quality is monitored at about 42 beaches and bays around the estuary through a collaborative State and Local Government program. Sampling is conducted weekly from December through March at the locations shown in our sampling and discharge points map.

To describe the risk level to swimmers a colour coded system is used based on five years of monitoring data: green indicates ‘Good’, yellow indicates ‘Fair’, and red indicates ‘Poor’ water quality.

Following the 2020–21 season, of the 20 swimming sites sampled, eight are now graded as ‘Good’, which is two less than last year. Seven sites are graded as ‘Fair’, an increase of one from the previous season. One site is graded as ‘Poor’ — there were no ‘Poor’ swimming sites last season.

Of the 22 environmental sites, nine sites are graded as ‘Good’, three less than the previous season. Seven sites are graded as ‘Fair’, three more the previous season. Five sites are graded as ‘Poor’, one more than the previous season.

Rainfall records this season were higher than the long-term summer average for the four BOM weather stations monitored as part of the RWQ program. There were six days throughout the summer with > 10 mm of rain recorded somewhere in the estuary, including some very heavy downpours above 40 mm. However, only a few of these rainfall events occurred within a 24-hour period prior to sampling. Analysis shows that while some results probably were influenced by rainfall, most were not.

Sandy Bay Regatta, 2021.

Image: Derwent Estuary Program

Taking a water sample from the beach.

Image: H. Bobbi, DOH

Water quality indicators

The DEP coordinates a whole-of-estuary monitoring program that integrates sampling carried out by the DEP and EPA Tasmania, Nyrstar Hobart, Norske Skog and TasWater. Water quality is monitored each month at 27 sites for indicators such as temperature, salinity, dissolved oxygen, suspended solids, nutrients, organic carbon, chlorophyll a and heavy metals. This information is used to document conditions and trends over time and to provide data for estuarine modelling and process studies.

Seasonally recurrent hypoxia reduces the productivity of 100 hectares of the upper Derwent estuary every summer around Sorell Creek and New Norfolk. Low oxygen levels can result in the release of nutrients and heavy metals from underlying sediments, and can also have adverse impacts on bottom-dwelling organisms and some species of fish.

Upper Derwent estuary hypoxic zone and bathymetry
Hypoxic risk zone and significant locations. Image: Derwent Estuary Program.

The hypoxic zone bathymetry is characterised by a sequence of troughs and sills which results in a dynamic relationship between local water quality and river discharge. River flow is a key factor influencing hypoxia dynamics. In winter, sustained high river discharge displaces the hypoxic salt wedge from this area. In summer, with the onset of markedly lower river discharge, the hypoxic zone becomes strongly stratified and during static conditions, oxygen becomes depleted over a period of about 5 days. Temporary oxygen recharge occurs with sustained higher river discharge that is sufficient to displace the salt wedge beyond the easternmost shallow sill that is located just southwest of the motorboat club. Oxygen recharge also occurs when reduced river discharge relieves hydrostatic pressure, allowing oxygenated saltwater to migrate westerly over the sills. This water is saltier than the resident waters so as it spills over the sills and sinks into the hypoxic troughs and mixes the resident waters, resulting in increased salinity and temporary reoxygenation.

Dissolved oxygen levels were uncharacteristically high in 2020. Unlike previous years where hypoxia was severe throughout the summer, dissolved oxygen levels, for the most part, remained high throughout the year. These results are likely a due to above average rainfall in 2020 and resultant high flows in the River Derwent.

Conceptual diagram of upper Derwent estuary hypoxia dynamics
2020 dissolved oxygen levels at New Norfolk (at depth)
100 90 80 70 60 50 40 30 20 10 0 dissolved oxygen (% saturation) Month (July 2020 – June 2021) Jul Aug Sep Oct Nov Dec Jan Feb Mar Apr May Jun Jul 2020 99.6% Aug 2020 101.8% Sep 2020 102.7% Oct 2020 98.1% Nov 2020 23.4% Dec 2020 96% Jan 2021 11% Feb 2021 1.6% Mar 2021 8.6% Apr 2021 92.3% May 2021 95.5% Jun 2021 97.3%
Month Dissolved oxygen (% saturation)
July 2020 99.6
August 2020 101.8
September 2020 102.7
October 2020 98.1
November 2020 23.4
December 2020 96
January 2021 11
February 2021 1.6
March 2021 8.6
April 2021 92.3
May 2021 95.5
June 2021 97.3

Rocky reef condition in the lower estuary

In 2019, DEP engaged the Institute for Marine and Antarctic Science (IMAS) to assess the functional status of reefs within the Derwent estuary using the rapid visual assessment (RVA) methodology. The aim of the survey was to examine whether the rocky reef communities could be used as an indicator of nutrient availability.

From north to south six sites were surveyed: Bellerive Bluff, Tranmere Point, Crayfish Point, White Rock, Blackmans Bay and Lucas Point. The results suggest that reef at both Bellerive and Tranmere was exposed to low-moderate nutrient enrichment, as indicated by the relatively high levels of epiphytic algae (algae that grows on other seaweed) observed at these sites, particularly in the March survey. Enrichment levels were not considered to be severe at Bellerive and Tranmere.

These surveys indicate that the RVA method provides a good indication of when reefs are subject to higher nutrient availability, with surveys providing a scientifically robust and important snapshot of reef function in the Derwent estuary. These surveys can be used to benchmark any future change that may occur within this system.

The full project report is available on the DEP website.

Crayfish.
Crayfish.

Image: IMAS

Contaminated sediments

Levels of heavy metals in Derwent estuary sediments are among the highest in Australia. Derwent sediments tend to be fine-grained and organic-rich and significantly exceed national sediment quality guidelines for zinc, copper, mercury, lead, cadmium and arsenic.

A University of Tasmania Honours study revisited metal levels in sediment, in addition to nutrient levels, with eight sediment cores collected over the summer of 2019–2020. Core U2 was taken from a site adjacent to the zinc smelter, and zinc concentrations in the surface sediment have decreased to just 13% of the recorded historical maximum at this location (2927 mg/ kg at 0.5 cm depth compared to 21840 mg/kg at 38.5 cm depth). The zinc and lead concentrations are not back to background levels at any middle estuary site, but the steady decreases demonstrate the successful reduction in metal contaminated effluent into the estuary since the 1970s.

Zinc concentrations in sediment core G2 (mid-estuary) versus sediment depth and age. Initial zinc concentration increase above background levels around 1910, and zinc concentration peaks around 1970.

Zinc concentrations in sediment core G2 (mid-estuary) versus sediment depth and age. Initial zinc concentration increase above background levels around 1910, and zinc concentration peaks around 1970.
2020 2000 1980 1960 1940 1920 1900 1880 1860 1840 1820 Sediment age (CFCS model) Zn (ppm) 0 500 1000 1500 2000 2500 3000 3500 0 10 20 30 40 50 60 70 Depth (cm) 0.5cm depth, 1600 Zn (ppm) 1.5cm depth, 1550 Zn (ppm) 2.5cm depth, 1920 Zn (ppm) 3.5cm depth, 2100 Zn (ppm) 4.5cm depth, 2160 Zn (ppm) 7.5cm depth, 2370 Zn (ppm) 9.5cm depth, 2650 Zn (ppm) 15cm depth, 2810 Zn (ppm) 21cm depth, 3220 Zn (ppm) 31cm depth, 814 Zn (ppm) 41cm depth, 278 Zn (ppm) 51cm depth, 95.2 Zn (ppm) 63cm depth, 82.2 Zn (ppm)
Middle depth (cm) Zn (ppm) Year (CFCS model)
0.516002019
1.515502017
2.519202015
3.521002013
4.521602012
7.523702006
9.526502002
1528101990
2132201977
318141954
412781926
5195.21892
6382.21829

Stevens, H., Chase, Z., Zawadzki, A., Wong, H., and Proemse, B.: Reconstructing the History of Nutrient Loads and Sources in the Derwent Estuary, Tasmania, Australia, using Isotopic Fingerprinting Techniques. Estuaries and Coasts 44, 2236–2249 (2021). https://doi.org/10.1007/s12237-021-00919-0

View from Blinking Billy Beach, Sandy Bay, Tasmania.

Image: Derwent Estuary Program

Habitats and species

Important habitats of the Derwent include rocky reefs, saltmarshes and wetlands. The Derwent is also home to huge numbers of plants and animals. Two of note are the spotted handfish and the little penguin and their conservation is supported by the DEP in cooperation with local councils, scientists, State Government and the community. Human health is a key reporting priority for the DEP, particularly heavy metal levels in fish and shellfish.

Estuarine habitat and species

Surveys of the Derwent estuary indicate that unvegetated, soft-bottom habitats are by far the most abundant habitats in the estuary (86%), followed by seagrass and macrophytes (7%; primarily in the upper estuary), tidal sandflats (6%; primarily in Ralphs Bay) and rocky reefs (1%; primarily in the lower estuary).

The spotted handfish (Brachionichthys hirsutus) is listed as Critically Endangered both federally and on the IUCN Red List, and as Endangered in Tasmania. It is a small (up to 120 mm long) benthic fish that between the 1960s and early 80s was frequently seen along shores of the Derwent and adjoining bays but has declined significantly in numbers in the mid-1980s. There are currently nine known populations in the Derwent and five outside the estuary.

In 2020, researchers from CSIRO combined handfish survey results from two time periods (1997–2014 and 2015–2019) into a single dataset and analysed it to estimate the average density of handfish across nine locations in the Derwent estuary. The results were complex but when looking at the entire time series it looks like there has been a significant population decline in the Derwent estuary, but the overall population appears to have stabilised since 2014. It is important to note that there was a change in the survey methodology and that early sampling was very patchy making results difficult to summarise.

Spotted handfish.
Spotted handfish.

Image: Rick Stuart-Smith

Surveying of spotted handfish in 2022 will include CSIRO scientists collecting additional brood stock for the spotted handfish captive breeding program, which is important for maintaining the wild population.

Handfish conservation work is overseen by the National Handfish Recovery Team (NHRT), which includes CSIRO and IMAS scientists and students, Zoo and Aquarium Association of Australia, Sea Life Melbourne Aquarium, Reef Life Survey Foundation (RLS), Aquenal, Seahorse World, DPIPWE, Marine Solutions, Derwent Estuary Program, NRM South, Sydney University, and the Australian Government.

Draught board shark, Lucas Point, Tasmania.

Image: IMAS

Heavy metals in seafood

Oysters and mussels from the Derwent contain high levels of heavy metals, particularly zinc, lead and cadmium. While levels appear to have declined since 2003 in some areas (i.e. above the Tasman Bridge), they are still far in excess of national food standards. Mercury levels exceed national food standards in several species of Derwent caught fish — particularly black bream — and to a lesser degree flathead and trout.

Sampling suggests that levels are lower in other recreationally targeted fish (e.g. whiting, Australian salmon, mullet, cod and flounder). Based on the most recent (2019–20) monitoring results for several recreationally caught seafood including flathead, oysters and mussels, there has been no change in current health advice, which is as follows:

  • Don’t eat shellfish collected from the Derwent (including Ralphs Bay)
  • Don’t eat any bream from the Derwent (including Browns River)
  • Limit consumption of other Derwent-caught fish to no more than 2 meals/week, or 1 meal/week for pregnant and breastfeeding women, women planning to become pregnant and young children

For a full report see Metal Contamination in Fish and Shellfish of the Derwent Estuary 2020 which summarises all metals in fish data up to the summer of 2019–20.

Marine pests, weeds and disease

The Derwent estuary is extensively colonised by introduced marine species. At least 79 invasive species have been recorded, including four species of particular national concern: northern Pacific seastar, European green crab, Japanese seaweed, and European clam. A number of other species (e.g. New Zealand half crab, New Zealand seastar, and New Zealand screw shell) also pose a significant threat to the ecology of the estuary.

Rice grass (Spartina anglica) — an invasive intertidal weed — has been successfully managed in the Derwent estuary through annual surveys and control actions. The area of infestation has been reduced from large “swards of over 100 m²” in 1995 to finding no plants in 2009 and 2010. Small patches have been observed since then in the middle estuary region, but none since spring 2016. Due to its invasive nature, the surveying for rice grass will continue. The rice grass survey also provides the opportunity to survey and inform land managers of other weeds and litter infesting the mid-estuary. A Derwent region weeds group has been established by the DEP with the aim of identifying emerging weed threats, sharing knowledge and resources.

Northern Pacific seastars.

Image: Peter Mathew / TasWater

Karamu.
Karamu.

Image: Jon Sullivan

Karamu (Coprosma robusta) is an evergreen shrub originating from New Zealand that is a declared weed under the Tasmanian Weed Management Act 1999, requiring landholders to remove it from their property. The upper Derwent estuary had previously been identified as the largest infestation in Tasmania. While much has been eradicated over the past five years, a large dense infestation remains around New Norfolk. Active and ongoing management of Karamu, led by the Derwent Catchment Project and a new management plan, includes participation from Department of State Growth, Parks and Wildlife Service, NRM South, DEP, Property Services Tasmania, and the Derwent Valley Council. In 2021 additional funding from the Weed Action Fund’s Large Grant was provided to the Derwent Catchment Project to help tackle the core infestation at New Norfolk that is proving particularly dense and difficult to access.

Did you know?

We are starting to see a decline in heavy metal levels in the water as well as sediments thanks to the inception of contaminated groundwater at Nyrstar.

Sampling sites and discharge points

The DEP Beach Watch and ambient water quality monitoring sites are located on the map along the location of wastewater treatment plants and our industry partners Nyrstar and Norske Skog Boyer.

Derwent estuary map kunanyi / Mount Wellington HOBART New Norfolk Bridgewater Austins Ferry Old Beach Claremont Glenorchy Moonah New Town Lindisfarne Bellerive Howrah Tranmere Rokeby Lauderdale South Arm Sandy Bay Taroona Kingston Blackmans Bay Tinderbox Bridgewater Causeway Bowen Bridge Tasman Bridge Iron Pot North West Bay Ralphs Bay Ambient monitoring site (temperature, salinity, pH, dissolved oxygen, nutrients, chlorophyll a, metals) Bellerive Beach (east) Bellerive Beach (west) Blackmans Bay (mid) Blackmans Bay (north) Blackmans Bay (south) Hinsby Beach Howrah Beach (east) Howrah Beach (mid) Howrah Beach (west) Kingston Beach (mid) Kingston Beach (north) Kingston Beach (south) Little Howrah Beach Little Sandy Bay (north) Little Sandy Bay (south) New Norfolk (The Esplanade) Nutgrove Beach (east) Nutgrove Beach (west) Taroona Beach Windermere Bay Beach Brooke Street Pier Brown’s River Cornelian Bay Elwick Bay Yacht Club Geilston Bay Hobart Rivulet (mouth) Kangaroo Bay Lindisfarne Bay Marieville Esplanade Mid-River Swim Berriedale Bay (MONA) Cameron Bay (MONA) MONA jetty Montagu Bay New Norfolk (Millbrook Rise Jetty) New Town Bay Old Beach Jetty Prince of Wales Bay Regatta Pavilion Sullivans Cove Victoria Dock Waterman’s Dock Brighton Brighton East Risdon East Risdon New Norfolk New Norfolk Bridgewater Bridgewater Cameron Bay Cameron Bay Rosny Rosny Rokeby Rokeby Blackmans Bay Blackmans Bay Prince of Wales Bay Prince of Wales Bay Macquarie Point Macquarie Point Sandy Bay (outfall from Selfs Point) Sandy Bay (outfall from Selfs Point) Selfs Point (outfall at Sandy Bay) Selfs Point (outfall at Sandy Bay) Norske Skog Paper Norske Skog Paper Nyrstar Hobart Smelter Nyrstar Hobart Smelter Water quality monitoring sites in 2021 Beach and bay monitoring sites (enterococci) Good water quality Fair water quality Poor water quality N/A – long-term rating not available Ambient monitoring sites (temperature, salinity, pH, dissolved oxygen, nutrients, chlorophyll a, metals) Sewage treatment plant discharges in 2021 < 1000 ML/yr 1000–2000 ML/yr > 2000 ML/yr Industrial discharges in 2021 > 50,000 kL/d EXPLORE MAP EXPLORE MAP

Use the “Explore map” button to find the Beach Watch and ambient water quality monitoring sites, the location and discharge rates of waste water treatment plants and large industry. The layers on the map can be viewed separately or together. Or view a list of the locations in the tables that follow.

Beach Watch water quality monitoring sites in 2021
Location Long-term rating
Bellerive Beach (east) N/A
Bellerive Beach (west) Good
Blackmans Bay (mid) Fair
Blackmans Bay (north) N/A
Blackmans Bay (south) N/A
Hinsby Beach Good
Howrah Beach (east) Fair
Howrah Beach (mid) Poor
Howrah Beach (west) Fair
Kingston Beach (mid) Good
Kingston Beach (north) Fair
Kingston Beach (south) N/A
Little Howrah Beach Good
Little Sandy Bay (north) Good
Little Sandy Bay (south) Good
New Norfolk (The Esplanade) Good
Nutgrove Beach (east) Fair
Nutgrove Beach (west) Fair
Taroona Beach Fair
Windermere Bay Beach Good
Bay Watch water quality monitoring sites in 2021
Location Long-term rating
Brooke Street Pier Good
Brown’s River Poor
Cornelian Bay Poor
Elwick Bay Yacht Club Fair
Geilston Bay Fair
Hobart Rivulet (mouth) Poor
Kangaroo Bay Good
Lindisfarne Bay Fair
Marieville Esplanade Poor
Mid-River Swim Good
Berriedale Bay (MONA) Fair
Cameron Bay (MONA) Fair
MONA jetty Good
Montagu Bay Good
New Norfolk (Millbrook Rise Jetty) N/A
New Town Bay Fair
Old Beach Jetty Good
Prince of Wales Bay Good
Regatta Pavilion Poor
Sullivans Cove Good
Victoria Dock Good
Waterman’s Dock Fair
Sewage treatment plant discharges
Location Result
Brighton < 1000 ML/yr
East Risdon < 1000 ML/yr
New Norfolk < 1000 ML/yr
Bridgewater < 1000 ML/yr
Rosny < 1000 ML/yr
Rokeby < 1000 ML/yr
Cameron Bay 1000–2000 ML/yr
Blackmans Bay 1000–2000 ML/yr
Prince of Wales Bay > 2000 ML/yr
Macquarie Point > 2000 ML/yr
Sandy Bay (outfall from Selfs Point) > 2000 ML/yr
Industrial discharges
Location Result
Norske Skog Paper > 50,000 kL/d
Nyrstar Hobart Smelter > 50,000 kL/d

Recent management actions

The Derwent Estuary Program provides science to guide management. Here are several management examples highlighting how pollution has and is being, reduced in the Derwent estuary and catchment.

Zinc smelter remediation

Bird’s eye view of Nyrstar Hobart Smelter. Image: Nyrstar Hobart.
Bird’s eye view of Nyrstar Hobart Smelter

Image: Nyrstar Hobart

Nyrstar Hobart continue to conduct extensive site remediation to reduce the zinc contaminant load including:

  • Construction of a 760 m long grout curtain coupled with an up-gradient groundwater collection system, isolating the most contaminated section of the site from the Derwent estuary, was completed in July 2021, with testing and commissioning occurring the later half of 2021. Groundwater extraction bores allow for the extraction and removal of metals from contaminated groundwater. Modelling indicates that this major system upgrade may (up to) double the current recovery of zinc from 80 to 160 tonnes per year.
  • Infrastructure construction to intercept stormwater and remove metals prior to its release to the Derwent. As of March 2020, the Nyrstar site is a closed-circuit stormwater system, with all stormwater captured and treated on-site prior to discharge.
  • Sealing the floor of the electrolysis basement, formerly a significant source of ongoing metal contamination to groundwater. This project was completed in 2018, with ongoing funding assigned for annual maintenance.

Little penguin management

Little Penguin (Eudyptula minor) family exiting burrow.

Image: JJ Harrison

An exciting Little Penguin ceramic nests project funded by Rural Arts in partnership with Kingborough Council involved a group of artists to create usable clay Little Penguin nests.

The artists incorporated all the needs of penguins and the people who monitor them in the design. Burrows need to maintain a consistent, cool temperature, have adequate air flow and include inspection hatches. The final 8–12 nests exhibited in October 2021 were sold (for fundraising) and generously gifted to the Penguin Advisory Group. The nests will be trialed in the field with temperature iButtons (with no penguin access), then all being well, they will be placed across our estuary penguin colonies and monitored as part of the regular PAG program.

To build our understanding of Little Penguins in Tasmania the Tasmanian Penguin Advisory Group (TPAG) finalised a Little Penguin Survey and Monitoring Toolkit. The Toolkit provides five survey and monitoring techniques that community groups and land managers can apply to help understand Little Penguin population trends and their distribution. Penguin Incident Reporting Protocols have also been produced to clarify what we can do if injured or orphaned penguins, contaminated birds or a suspected a dog attack is encountered.

Howrah Beach stormwater system improvements

Howrah Beach aerial view.

Image: Clarence City Council

Council ramped up investigations into water quality earlier this year after the DEP annual water quality report noted that the middle section of Howrah Beach had been downgraded from ‘fair’ to ‘poor’, triggering a ‘swimming not recommended’ advisory for part of the popular beach.

So far, council’s investigation has identified 27 issues in the area that may be impacting the beach water quality, all of which have either been resolved, approved to be fixed or are under further investigation. This has included water, sediment, stormwater outfall, and ammonia testing in our stormwater networks, as well as groundwater monitoring in Wentworth Park. So far, some promising progress has been made with several stormwater and sewerage issues already resolved with the help of TasWater.

Making the connection between beach water quality and the stormwater system

Source tracking, Howrah.

Image: Derwent Estuary Program

Thanks to Department of Health funding, the DEP in cooperation with its partners developed a communications campaign to raise awareness of stormwater and its link to recreational water quality. The main objective is to inform the general community about:

  • How pollution is picked up by stormwater and flows through a complex catchment and ends up in our creeks and at the beach.
  • How we can make a positive difference to stormwater quality
  • What the DEP and its partners are doing to help improve stormwater quality

Short, funny educational cartoon videos are one of the outputs from this collaboration:

Empowering people to prevent sediment and erosion pollution

Empowering people to prevent sediment and erosion pollution.
Sediment and erosion control training course.

Image: Derwent Estuary Program

Sediment and erosion control plays an important role in reducing the pollutant load into waterways. Recognising this the DEP offered training to our partner organisations to keep this element of construction and development front of mind and increase knowledge and management capacity.

Construction site sediment loss is the biggest contributor of all sediment pollution in urban areas. A one-hectare construction site with an average slope of 12% with moderately erosive soils in greater Hobart, can have sediment loss of 250 tonnes by sheet flow (which is the uniform removal of soil in thin layers) over 12 months. Additionally, more soil will be lost because of concentrated runoff and wind effects. In general, the amount of soil lost during a construction period is equivalent to the next 30 years of soil loss on an undeveloped site through natural erosion processes.

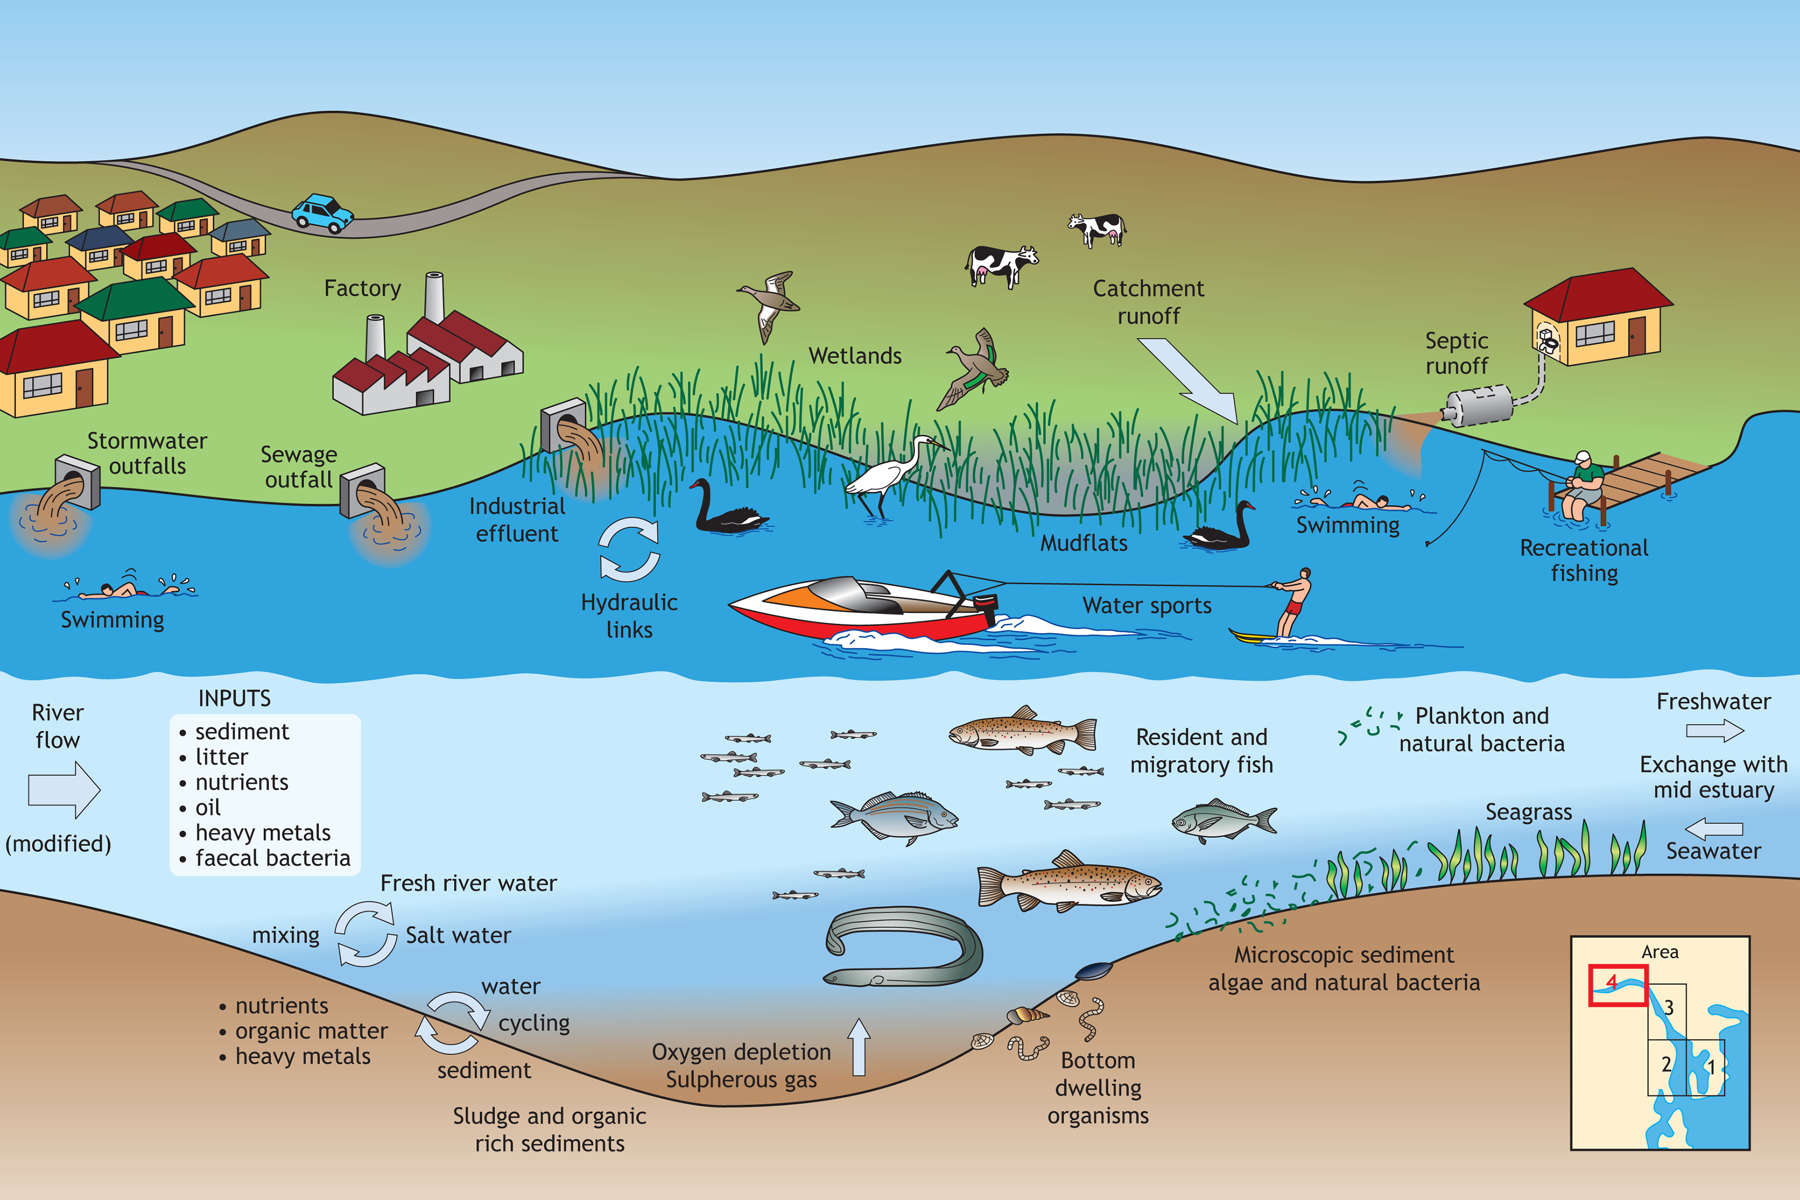
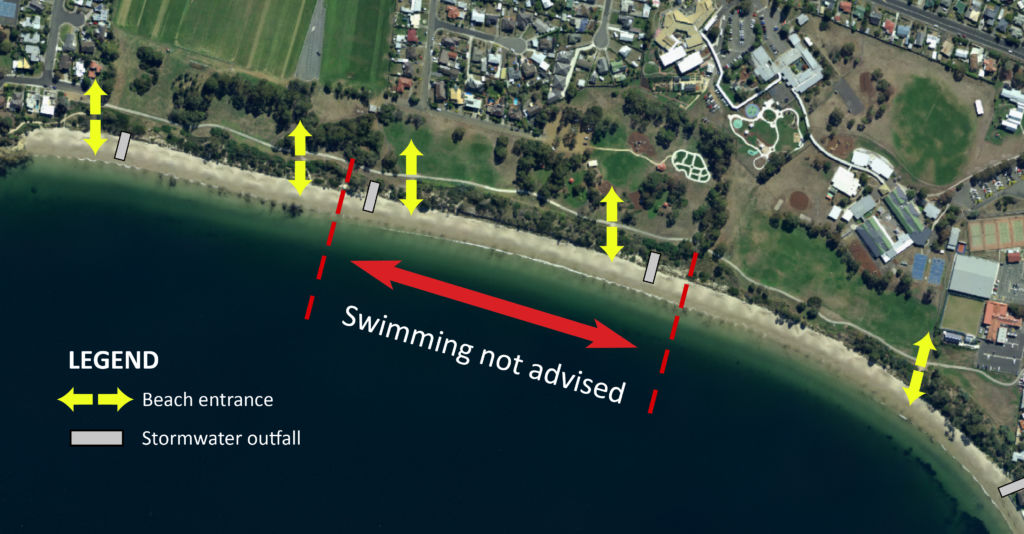
Sediment and erosion control is the practice of minimising the removal of sediment from worksites. Sediment generally leaves construction sites via stormwater and is transported into receiving waters such as rivers, creeks and the Derwent. It is crucial to manage sediment well, as it smothers waterway habitats, blocks stormwater drains and creeks, and negatively affects the feeding and breeding behaviour of fish and invertebrates. Sediment also acts as a transport mechanism for nutrients and heavy metals, so keeping them out of our waterways in the first place is more effective for water safety and quality control, and more cost effective than managing them when they are already in the waterway.

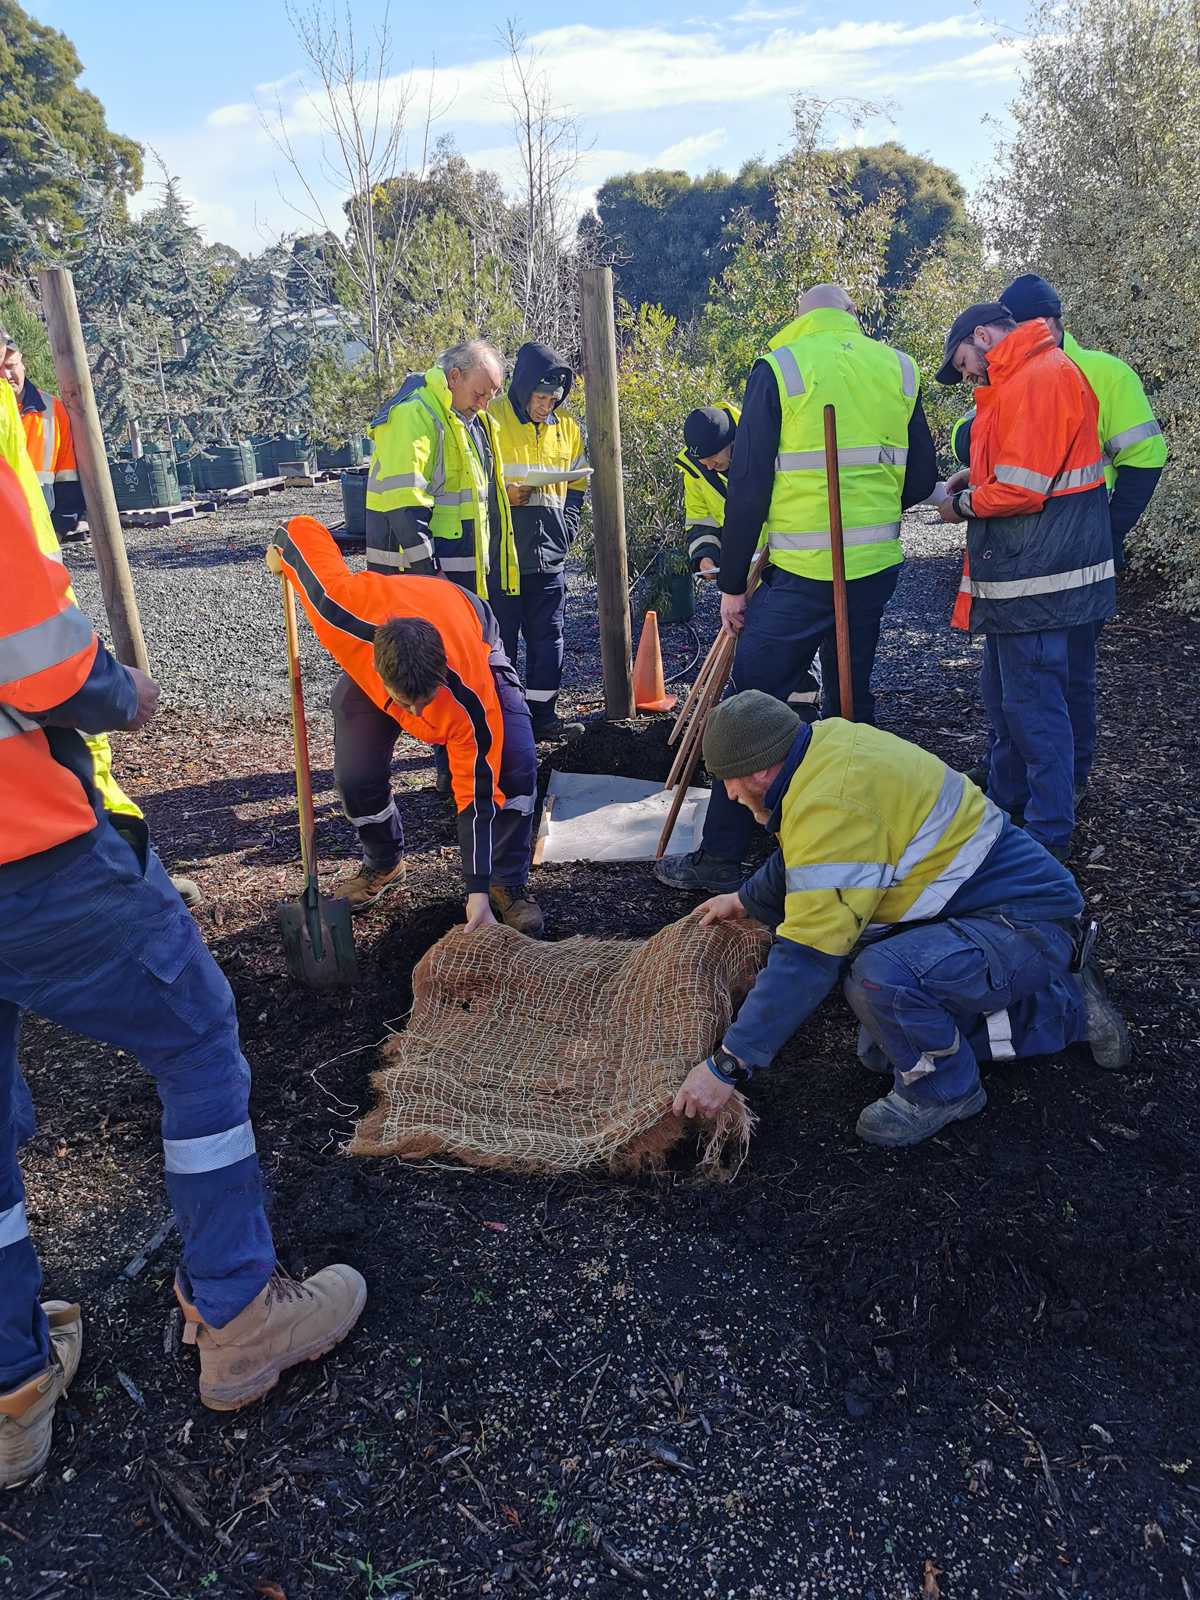
Given the impact of sediment erosion can have on the Derwent, the DEP organised two sediment and erosion control training courses, one for council works staff, and one for council designers and development application assessors. Both courses were run by Terry from TOPO, who is an Environmental Engineer with 16 years’ experience in soil and water management.

Content covered the following aspects of sediment and erosion control:

  • Sediment controls – catching the soil before it causes harm (typical end of line control e.g. sediment fencing)
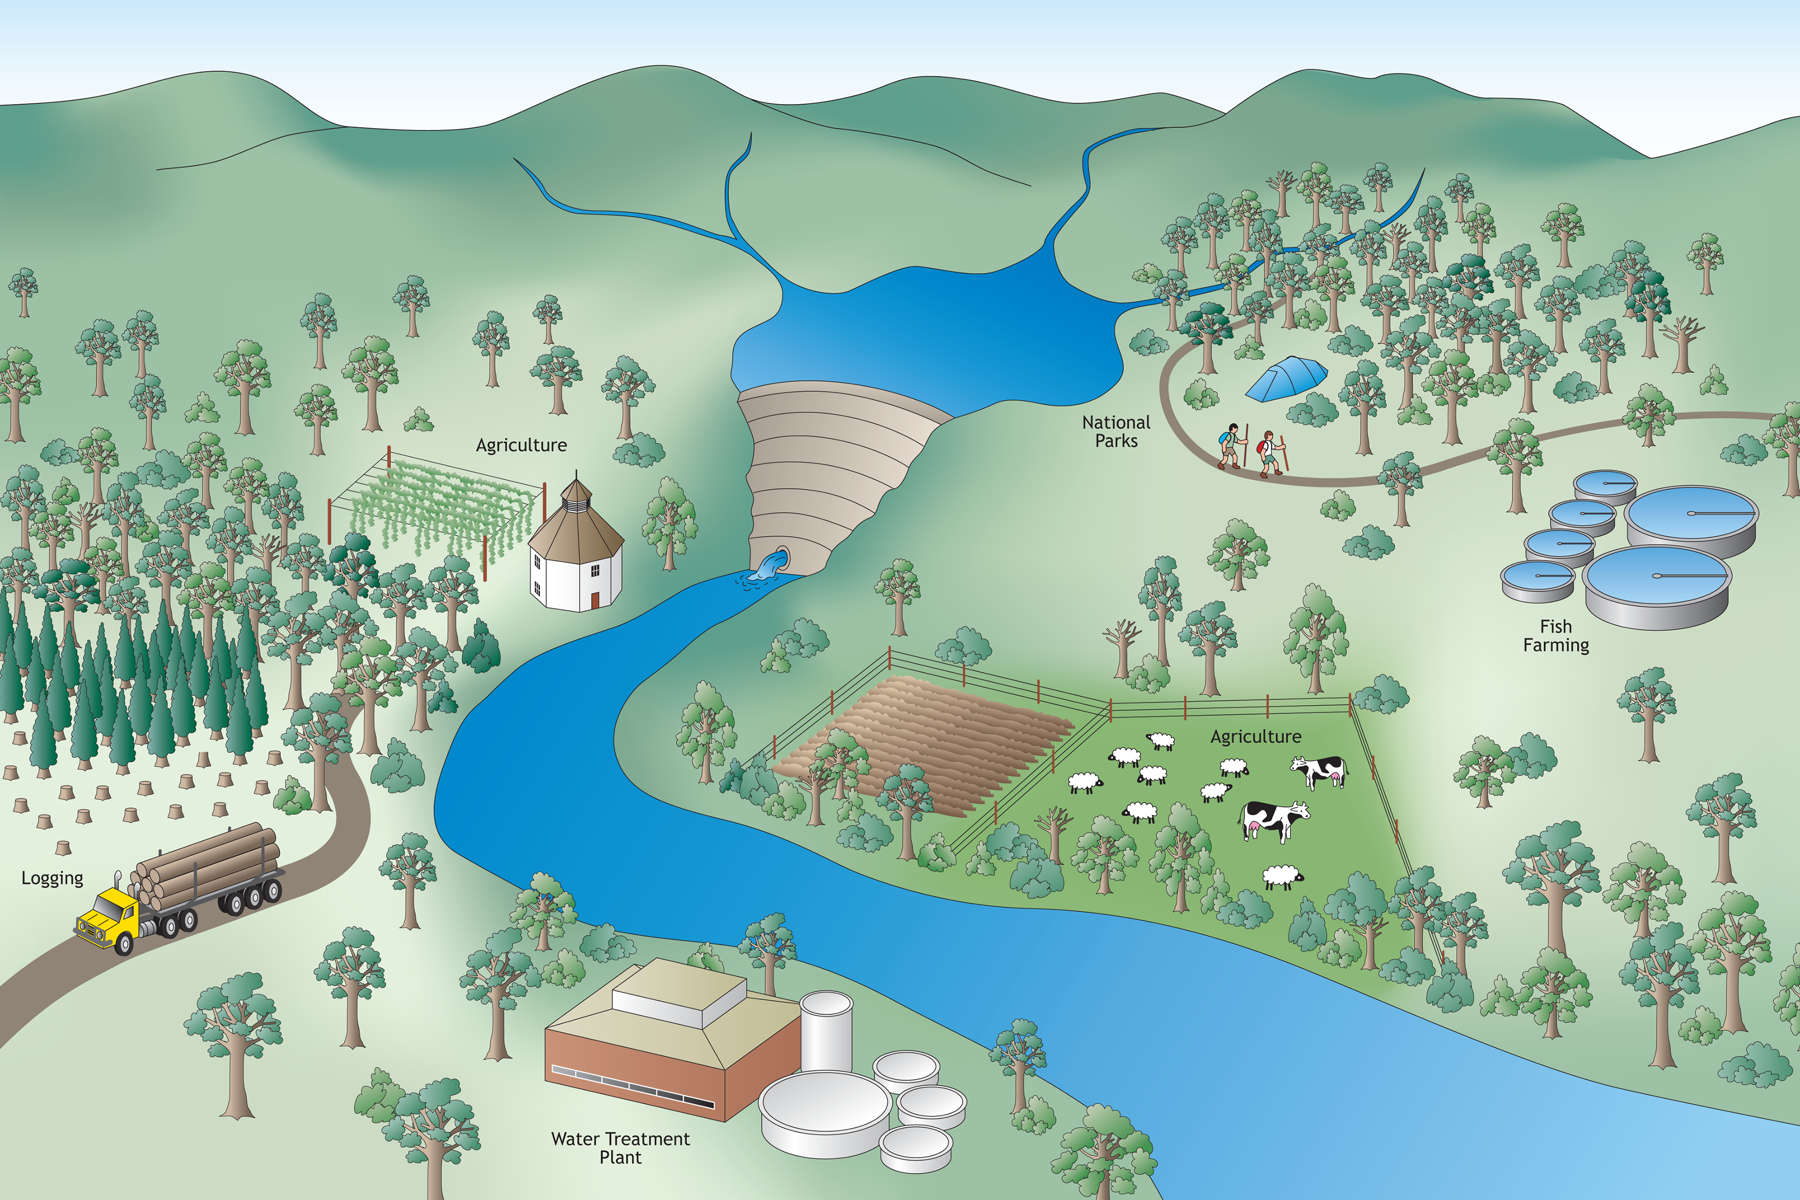
  • Drainage controls – controlling flows to prevent erosion, diverting clean water around sites so it doesn’t become contaminated and managing dirty water through sites to minimise impacts.
  • Erosion Controls – preventing soil particles becoming mobilised (preventative measures)

State of the Derwent 2020

State of the Derwent Estuary 2020 Update cover image

Hobart is a capital city that boasts swimmable beaches, an extensive network of walking and cycling tracks and great opportunities for boating and fishing. A major report looking at the health of the Derwent over the past five years has found the condition of the estuary has improved in some areas and declined in others.

This report highlights areas we can work on to maintain the health of this highly valued waterway. The State of the Derwent report summarised trends in industrial, sewage and stormwater discharges, monitoring results for swimming beaches, heavy metal levels in sediments and seafood, and the condition of key habitats and species. The report also highlights actions taken to clean-up the Derwent during this time.

Find it at State of the Derwent 2020.

Reeds

Image: iStock / narcisa