Introduction to the estuary, its management and monitoring
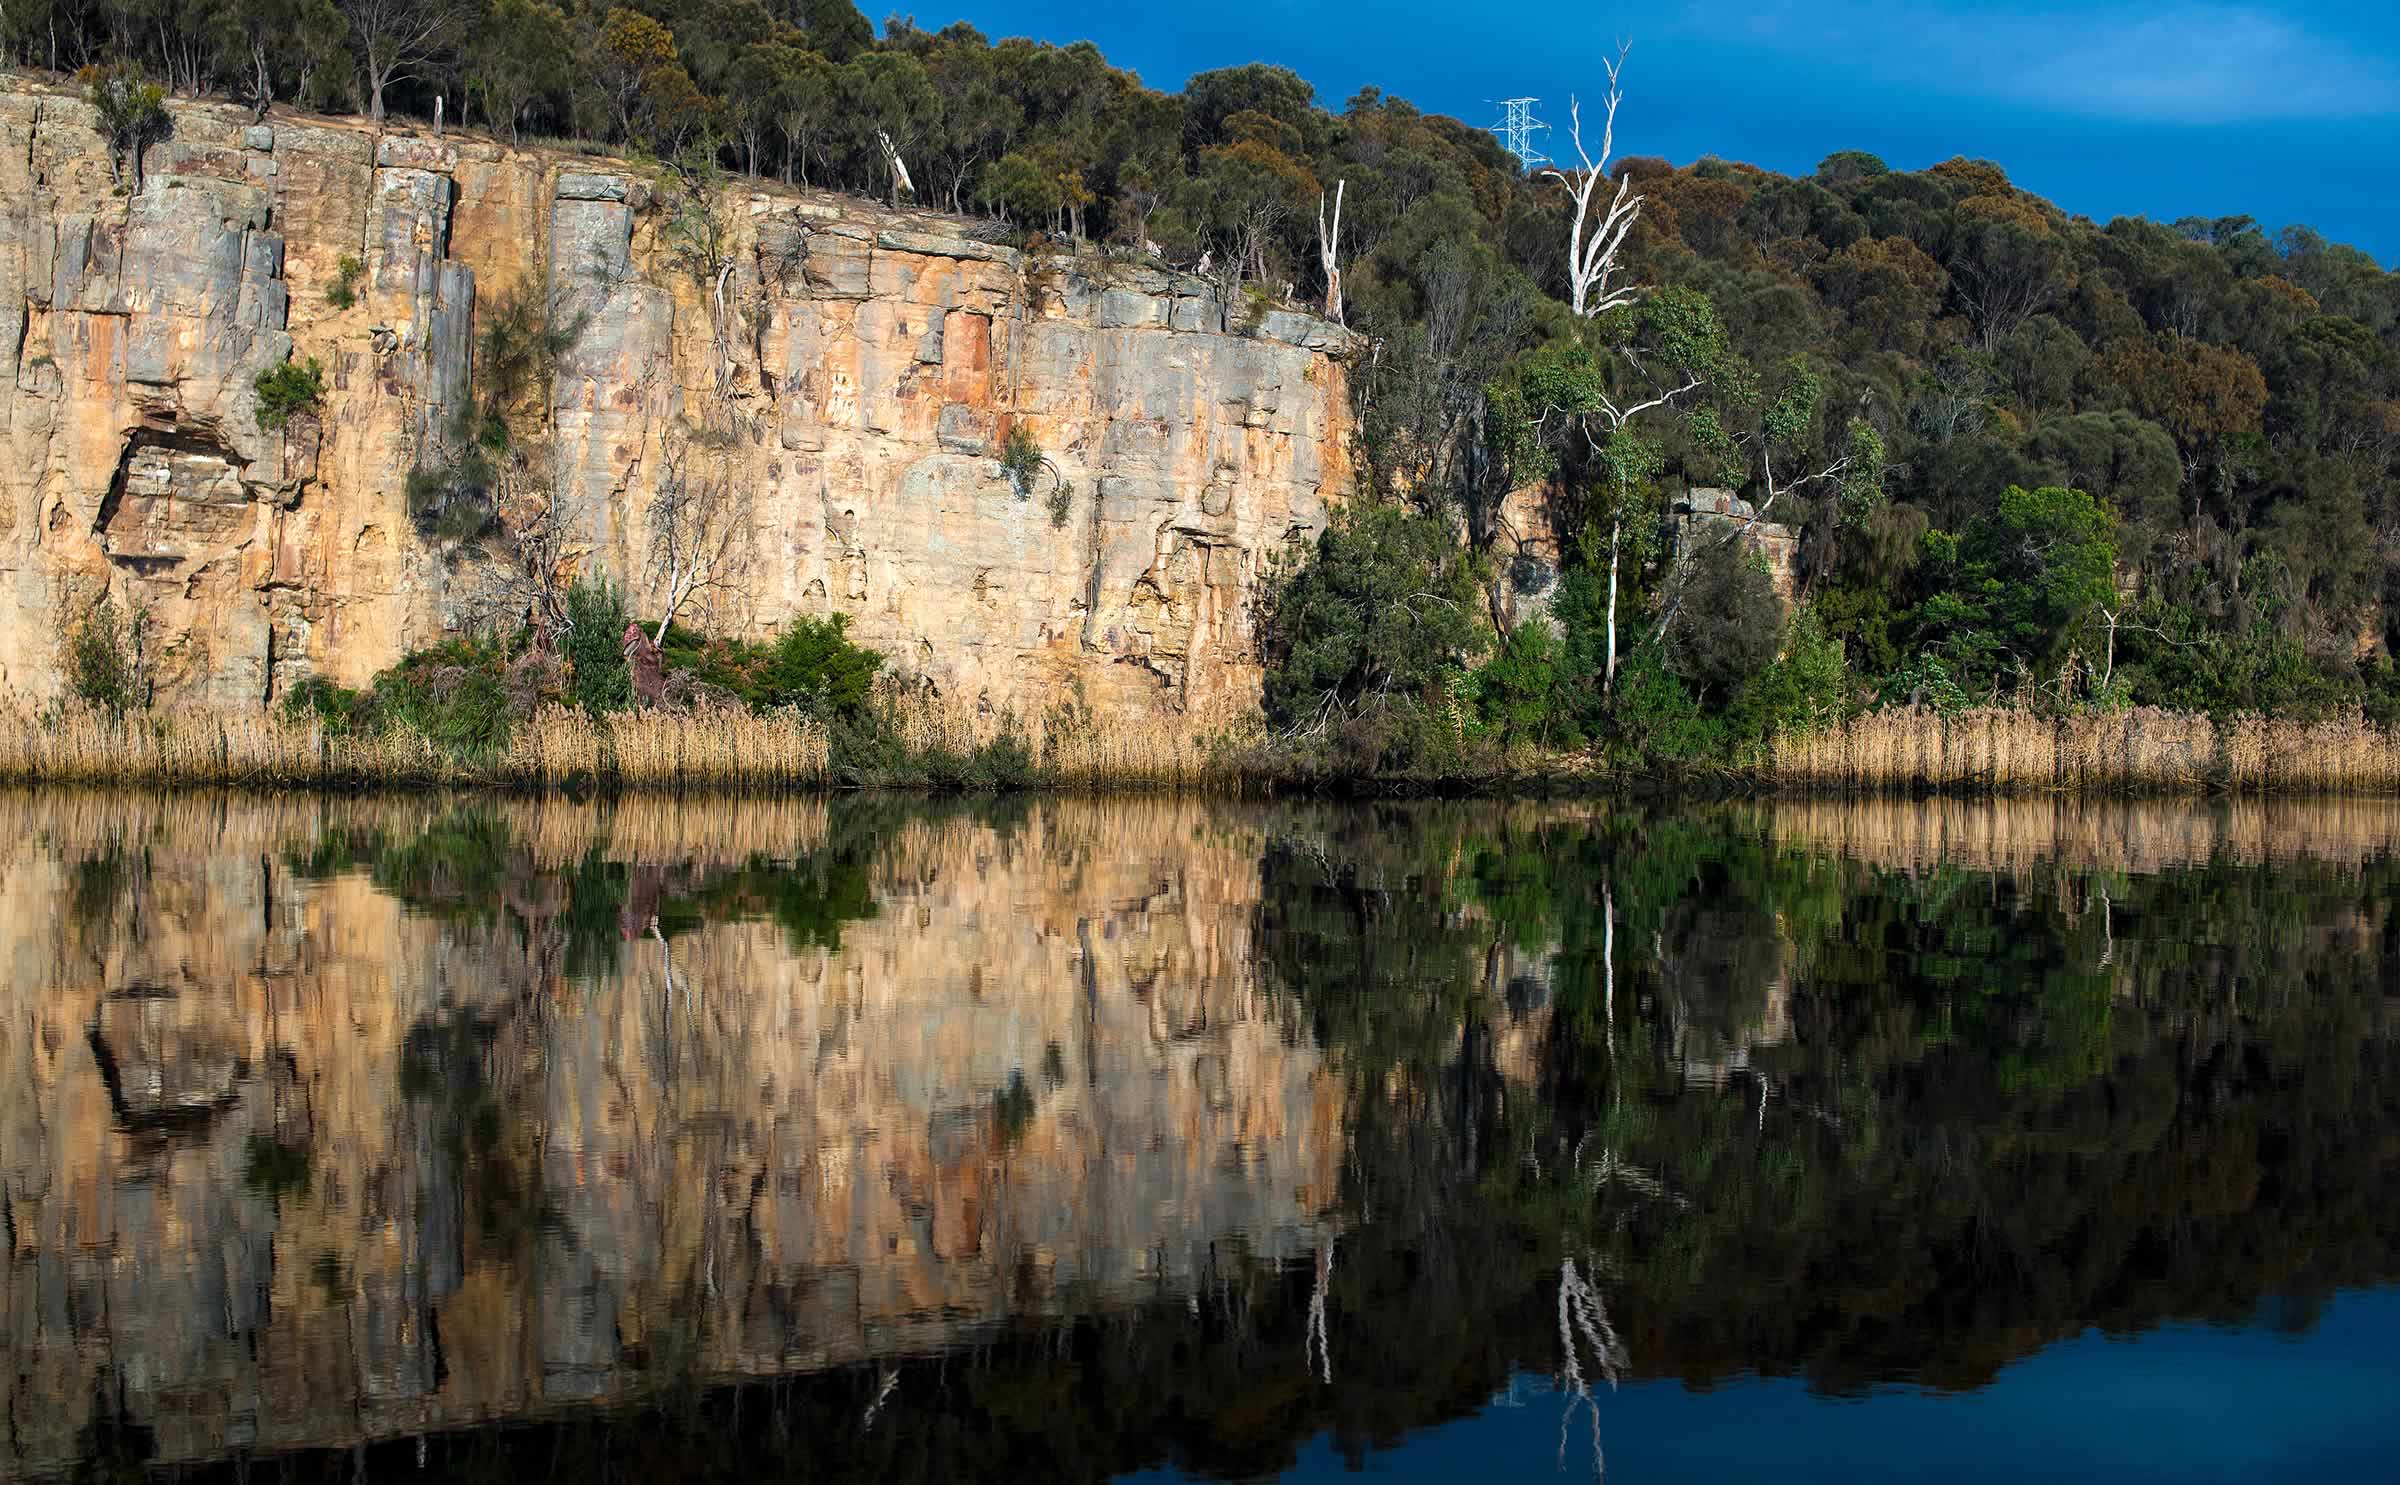
The Derwent estuary lies at the heart of the Hobart metropolitan area and is a waterway of great natural beauty and diversity. Named after the Celtic word ‘clear water’ in 1794, the Derwent is an integral part of Tasmania’s cultural, economic and natural heritage. The estuary is an important and productive ecosystem and supports a wide range of habitats and species.
Introduction
Approximately 43% of Tasmania’s population — 221,000 people — live around the estuary’s margins. The Derwent is widely used for recreation, boating, fishing, marine transport and industry. Further upstream, the River Derwent supplies the majority of the region’s drinking water and is a major source of hydroelectric power.
A number of environmental issues affect the Derwent estuary, in particular:
heavy metal contamination
poor recreational water quality at some bays and beaches
low oxygen levels in the upper estuary during summer
elevated nutrient concentrations
environmental flows and barriers
introduced marine pests and weeds
loss of habitats and species
impacts of climate change, e.g. sea level rise, erosion and habitat loss
Although there have been significant improvements in the treatment of sewage and industrial wastes over the past decade, the Derwent still faces a number of environmental challenges. A strategic and coordinated planning approach across all levels of government, industry and the community is our best hope for a clean and healthy estuary in the future.
The Derwent Estuary Program (DEP) was established in 1999 as a partnership to restore and protect the Derwent estuary. The program has been successful in bringing together a wide range of stakeholders — firstly to build a common understanding, vision and management framework — and secondly to progressively implement this vision through partnership agreements and practical actions.
The program was initially designed to address environmental quality issues such as industrial and urban water pollution, contaminated sediments, invasive species and loss of estuarine ecosystems. More recently, our scope has broadened to include the catchment and channel influences, as well as education and amenity. Key program areas include environmental monitoring and reporting, coordination of regional activities, stormwater management, heavy metal investigations, wetland and seagrass conservation, and promotion of walking tracks.
A fundamental requirement for effective natural resource management is an on-going and reliable source of environmental data. This principle forms the basis of the DEP’s cooperative monitoring program between the state government, councils, industries and research institutes. Formerly independent monitoring programs are now coordinated so as to provide better information on the estuary as a whole, and to report annually on environmental conditions and trends in the Derwent.
This ‘Report Card’ summarises monitoring data collected by the DEP and our partners, as well as other relevant information collected during 2017 and early 2018, including:
weekly recreational water quality testing during summer months
monthly whole-of-estuary and catchment water quality monitoring
surveys of heavy metal levels in fish and shellfish
biological surveys (seagrass, spotted handfish, little penguins)
weed surveys and control actions (rice grass, karamu)
More detailed information is published in five-yearly State of the Derwent Estuary reports, available on our website.
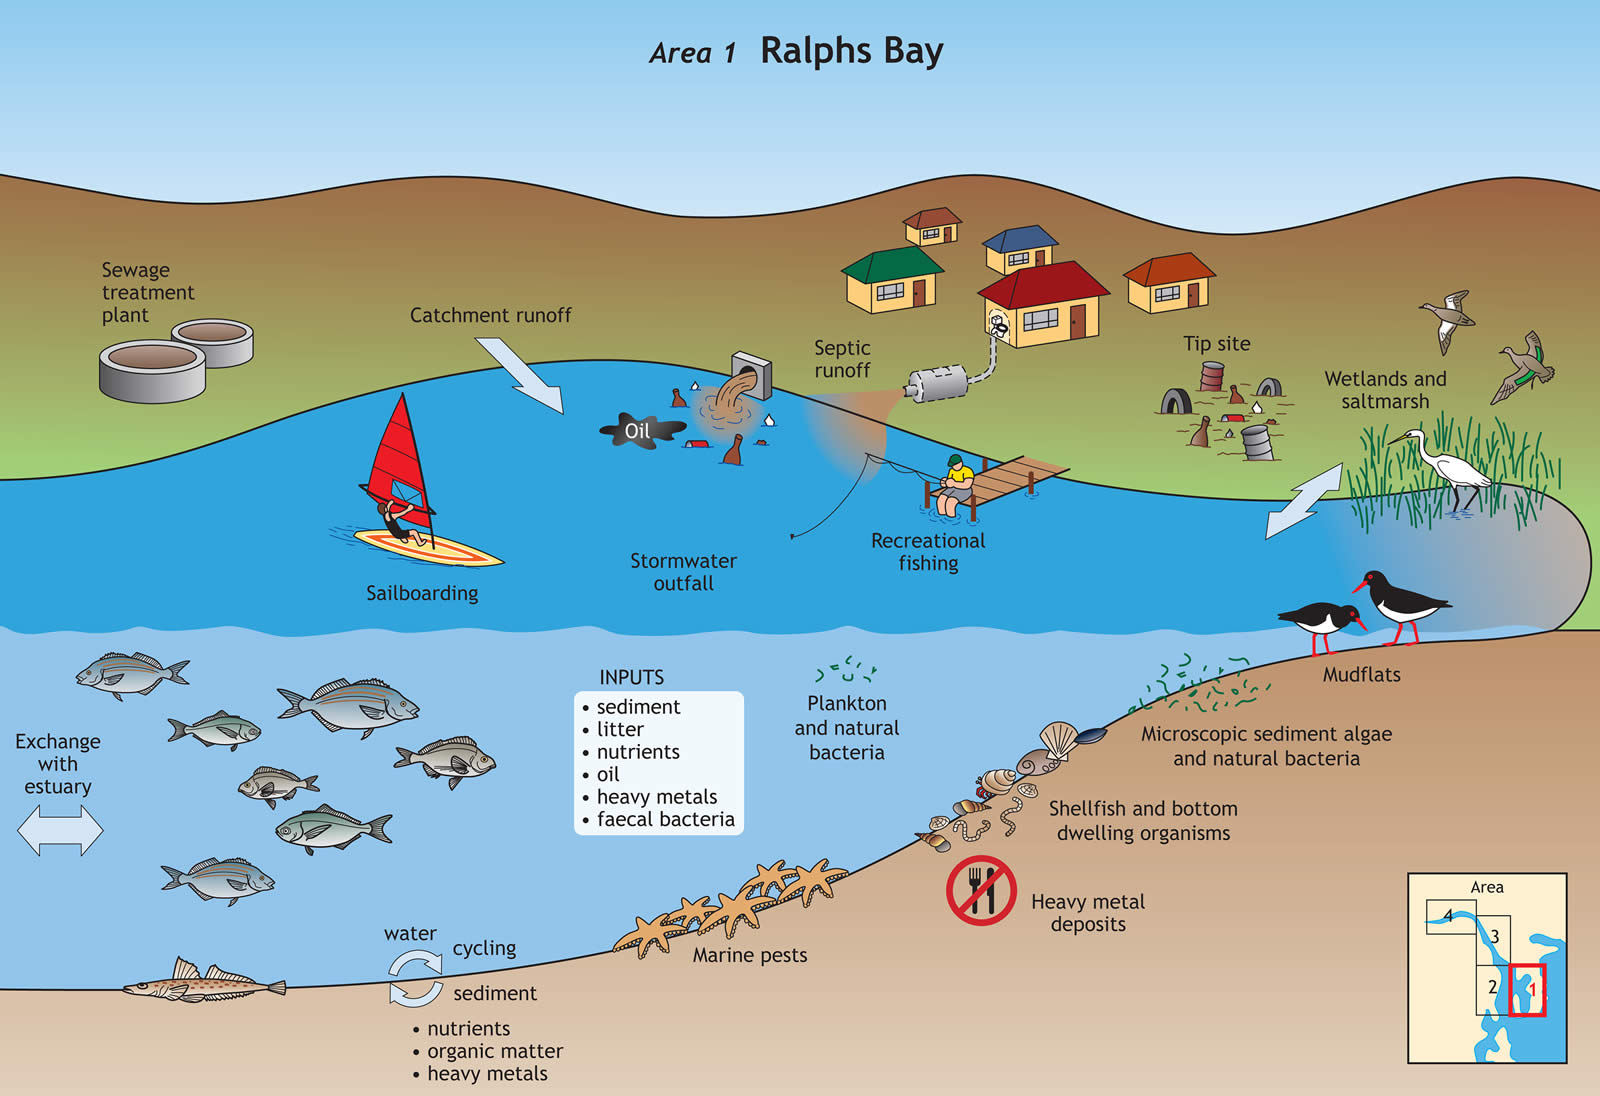
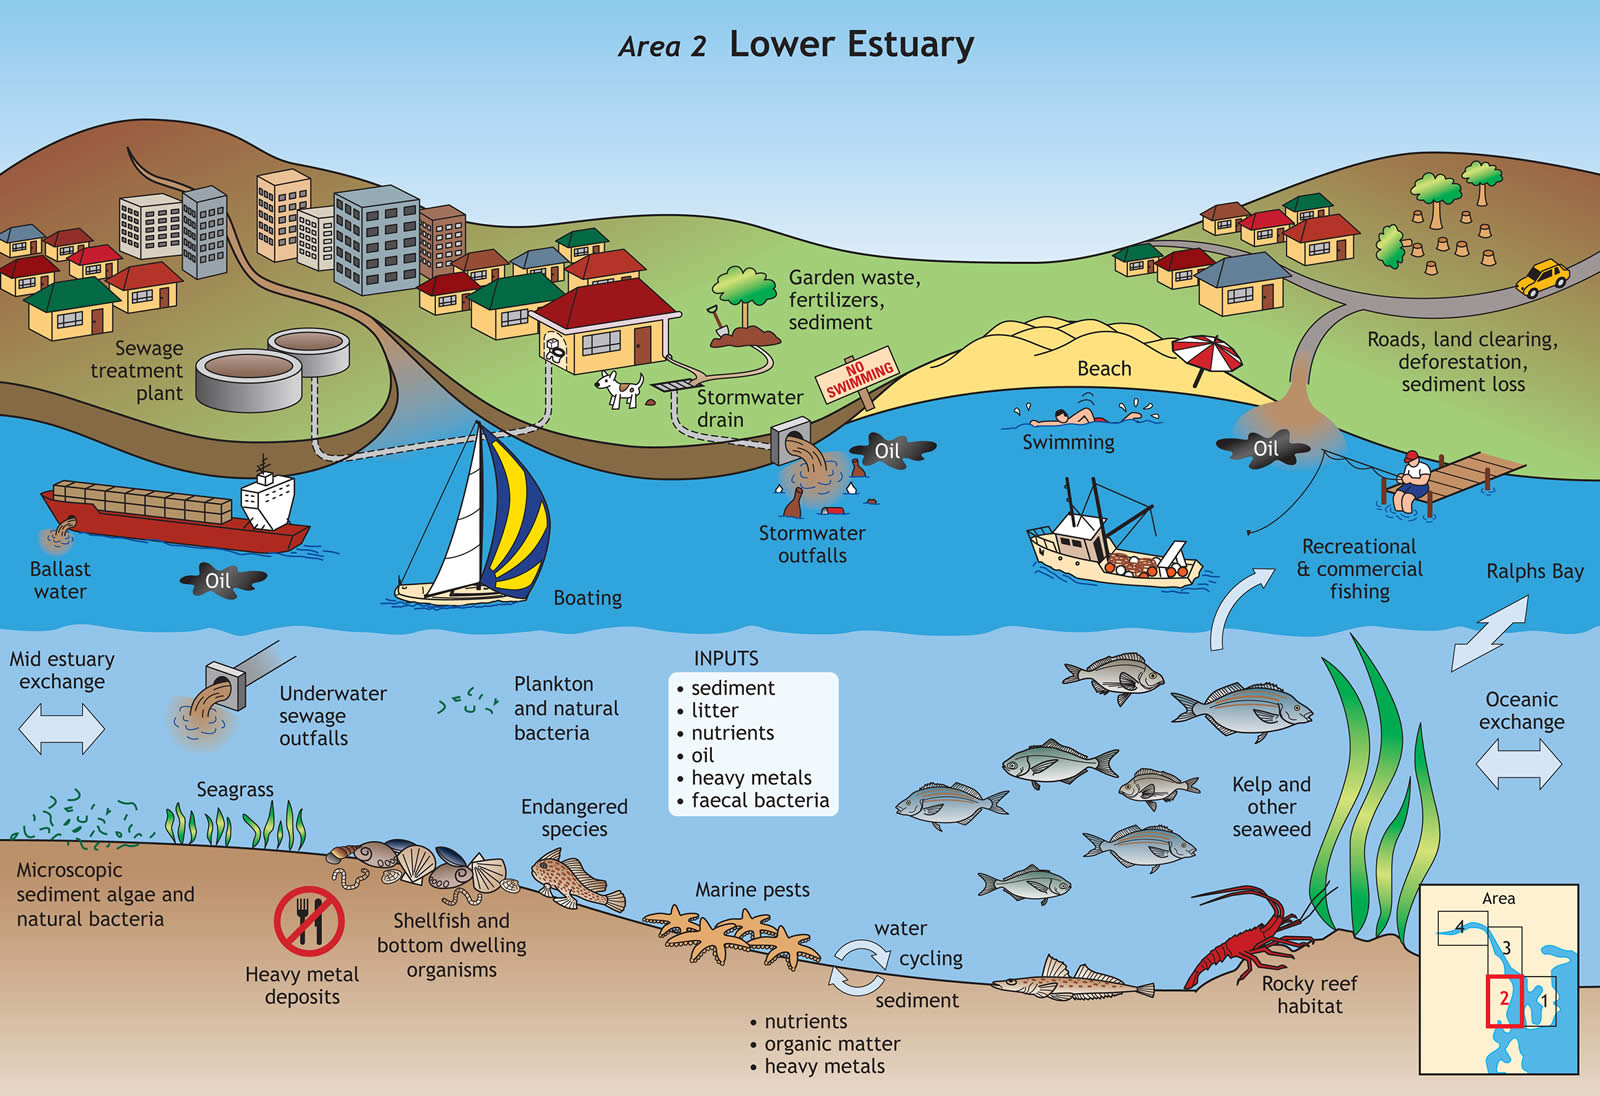
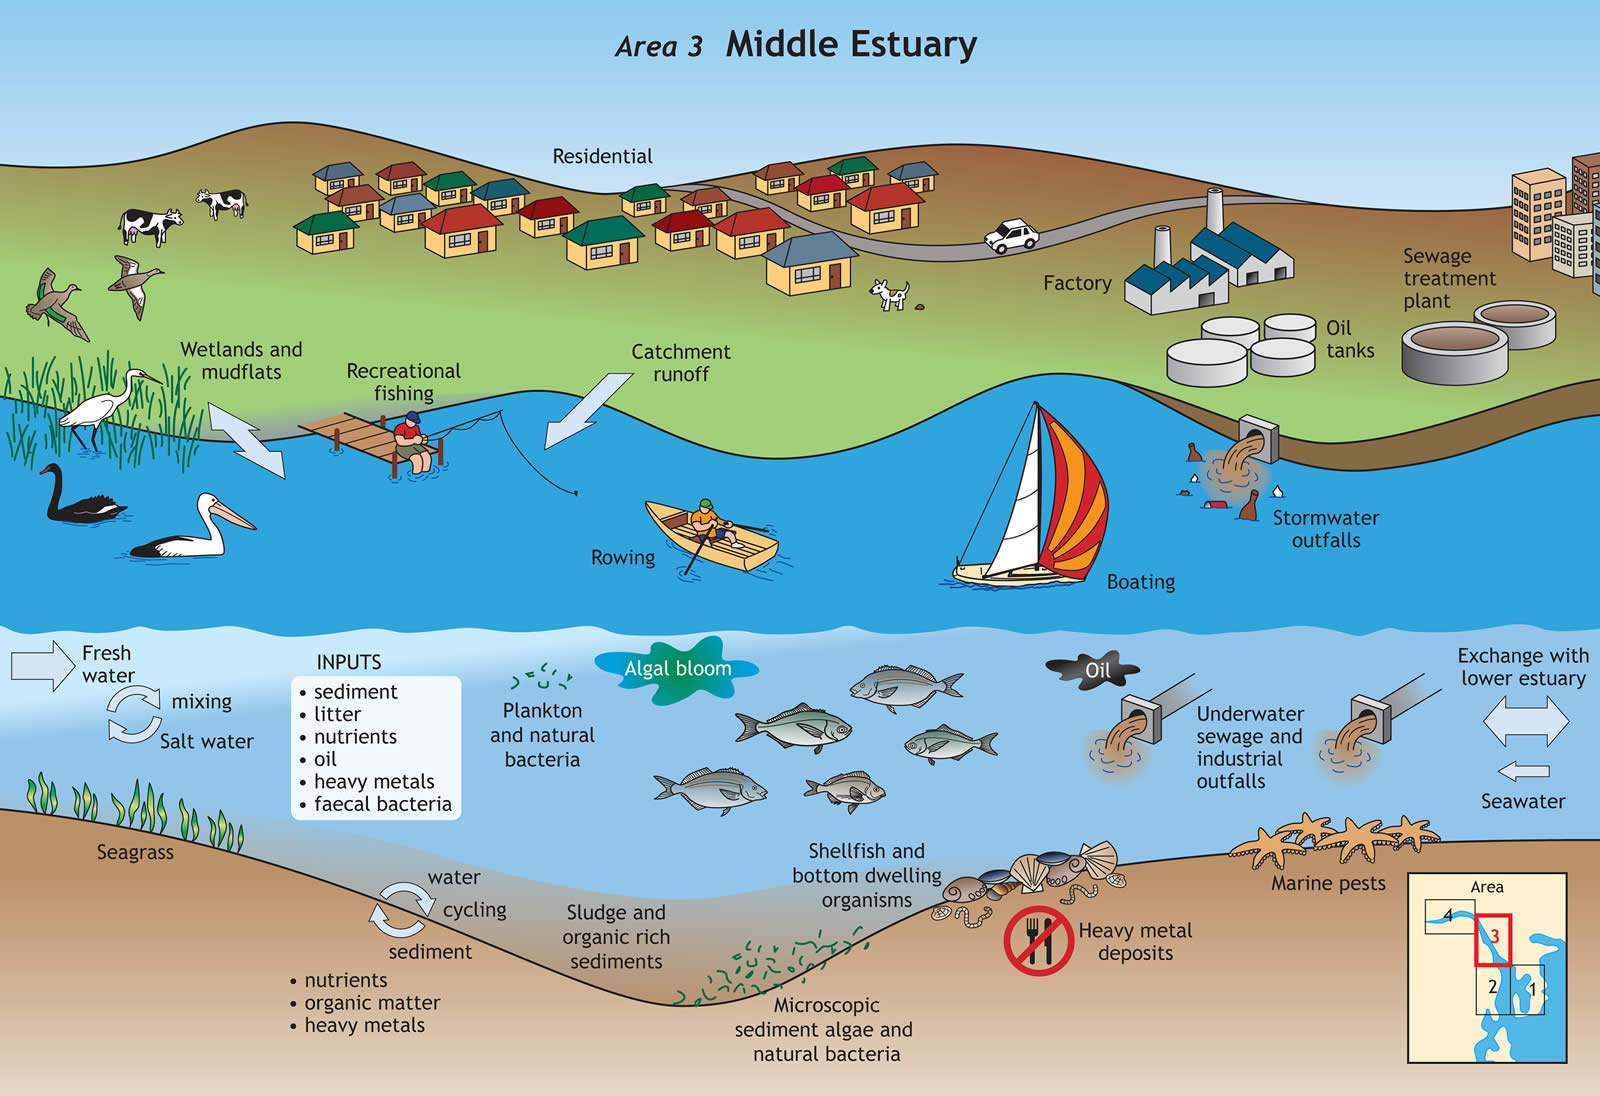
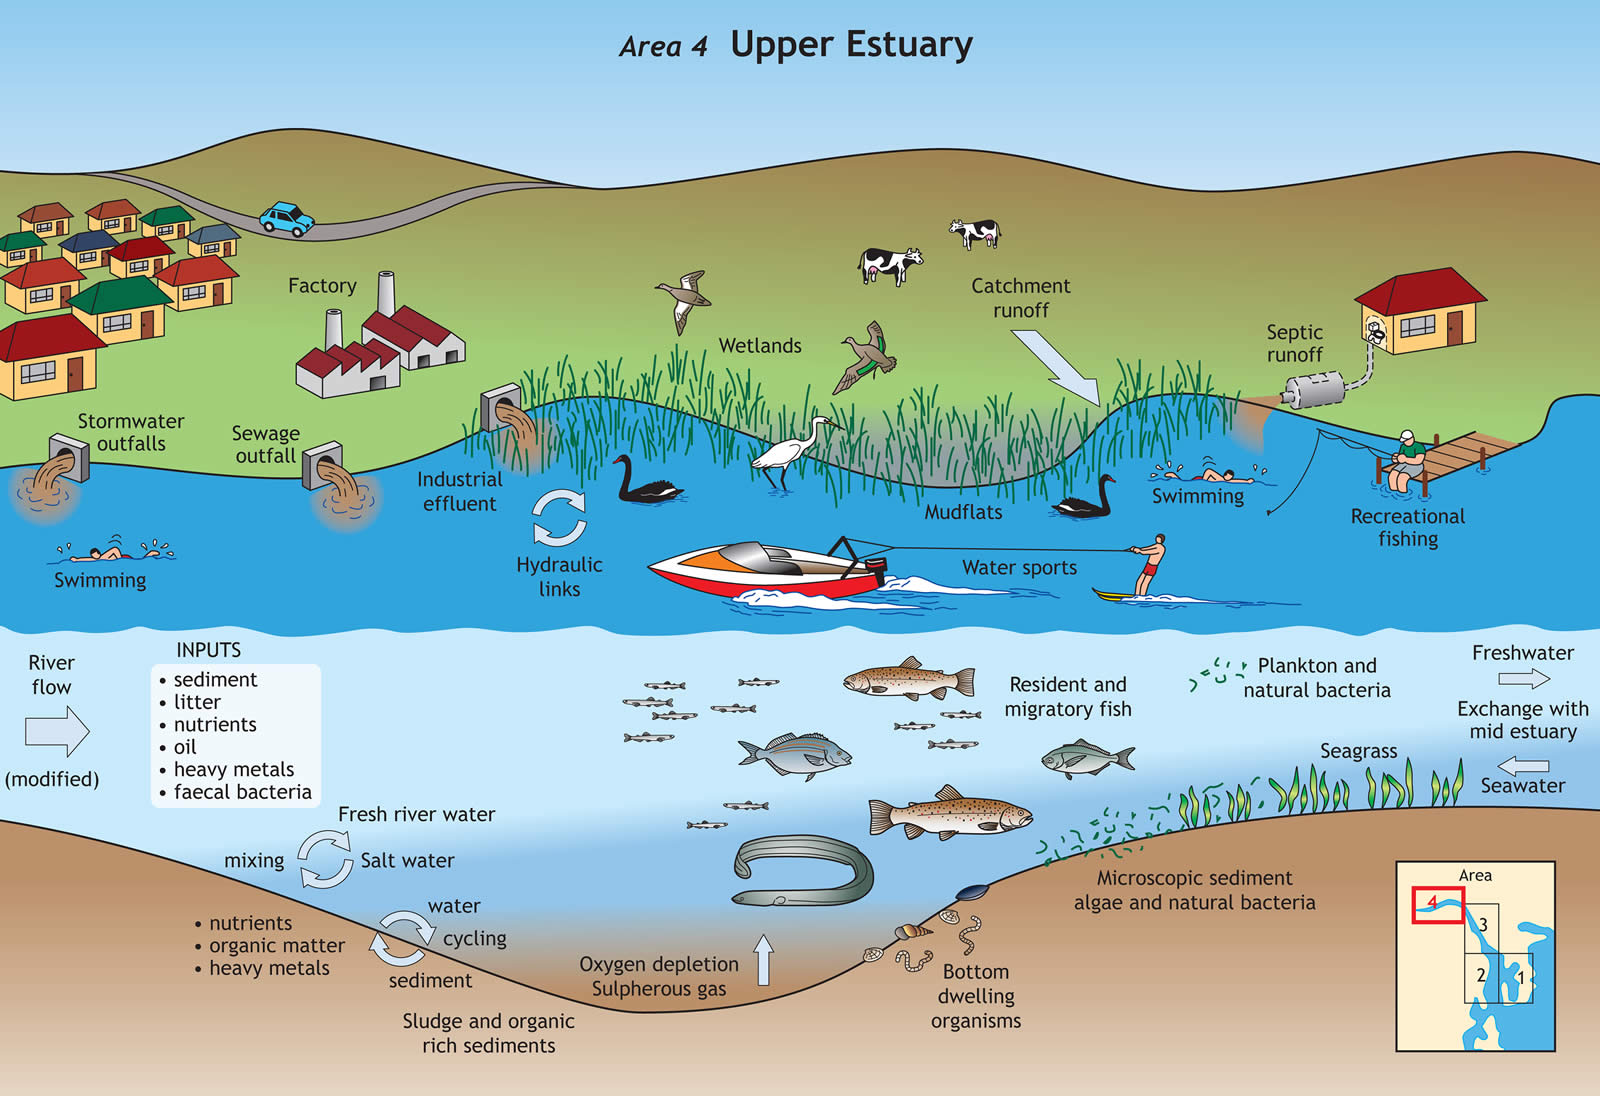
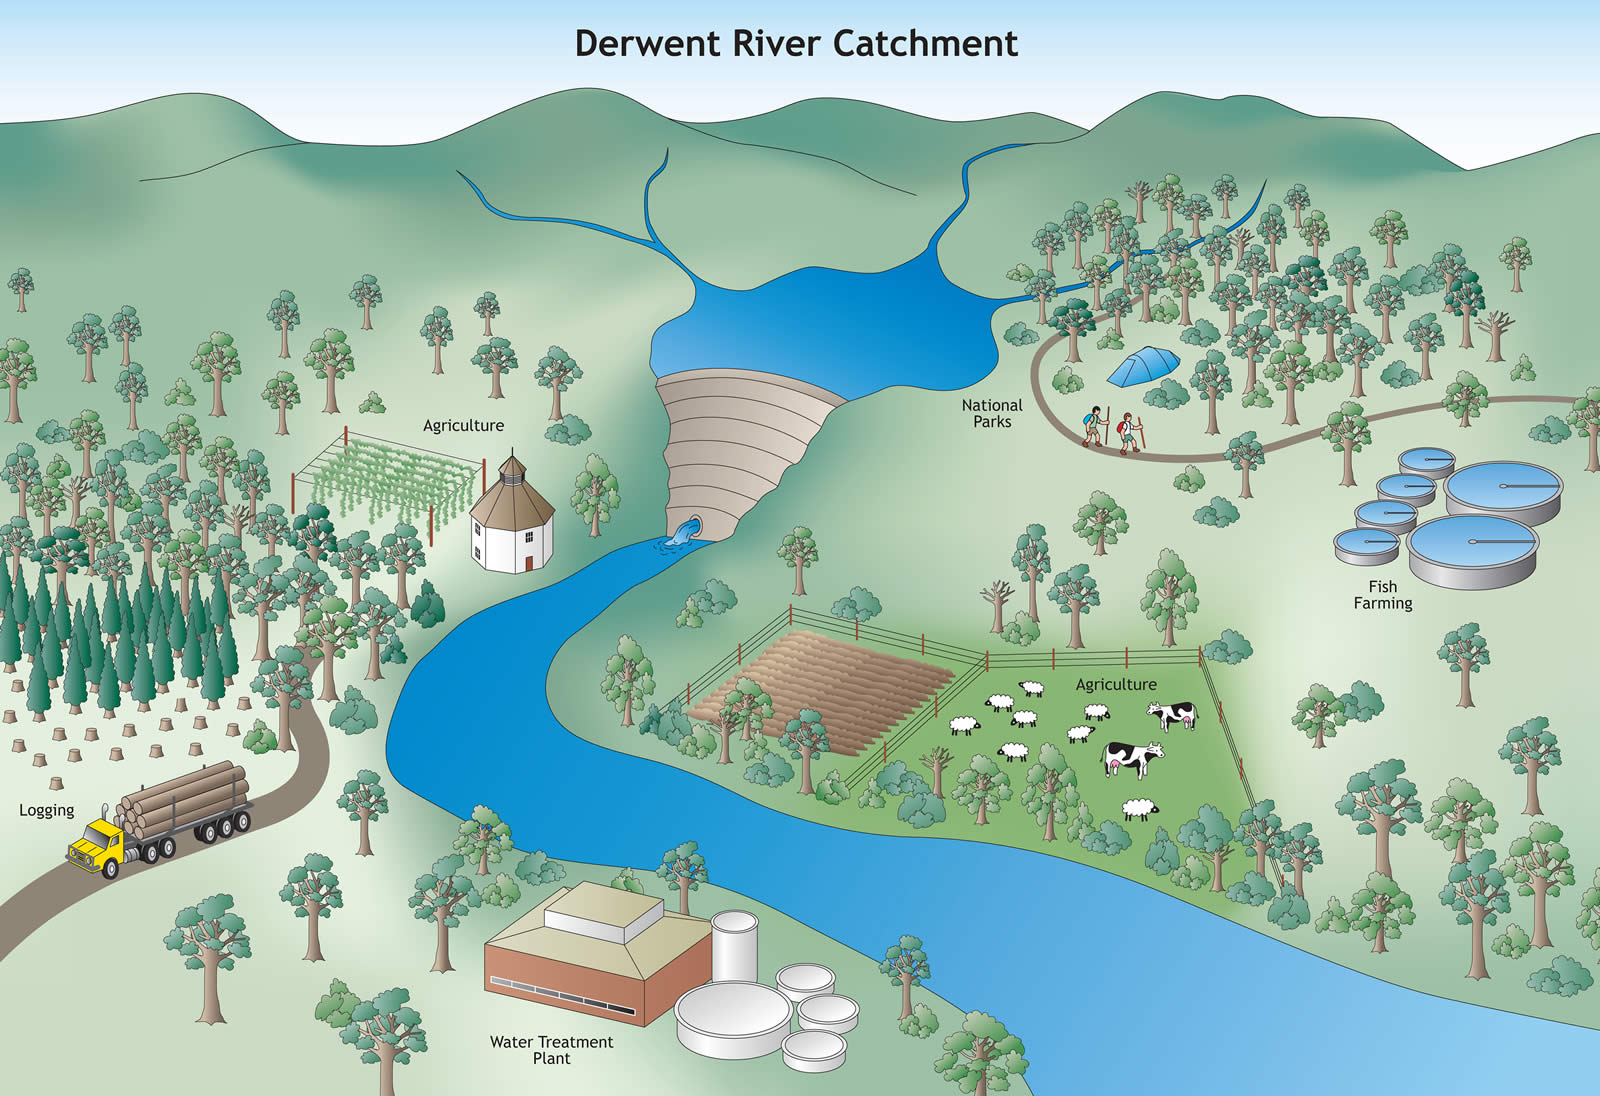
From the river to the sea the River Derwent and estuary supports a variety of habitats, species and human uses which are depicted in the following five illustrations. Environmental inputs that affect these areas are also highlighted.
Pollutants of particular concern in the Derwent estuary include:
heavy metals, as these may be toxic to aquatic plants and animals, and accumulate in seafood — a potential health risk for local anglers.
excessive nutrients, as these can trigger algal blooms that reduce water clarity, smother fish habitat and deplete oxygen. Low oxygen may result in fish kills, rotten egg odours and release of nutrients and heavy metals from sediments.
pathogens from human sewage that are a human health risk
sediments, as these reduce light available to aquatic plants
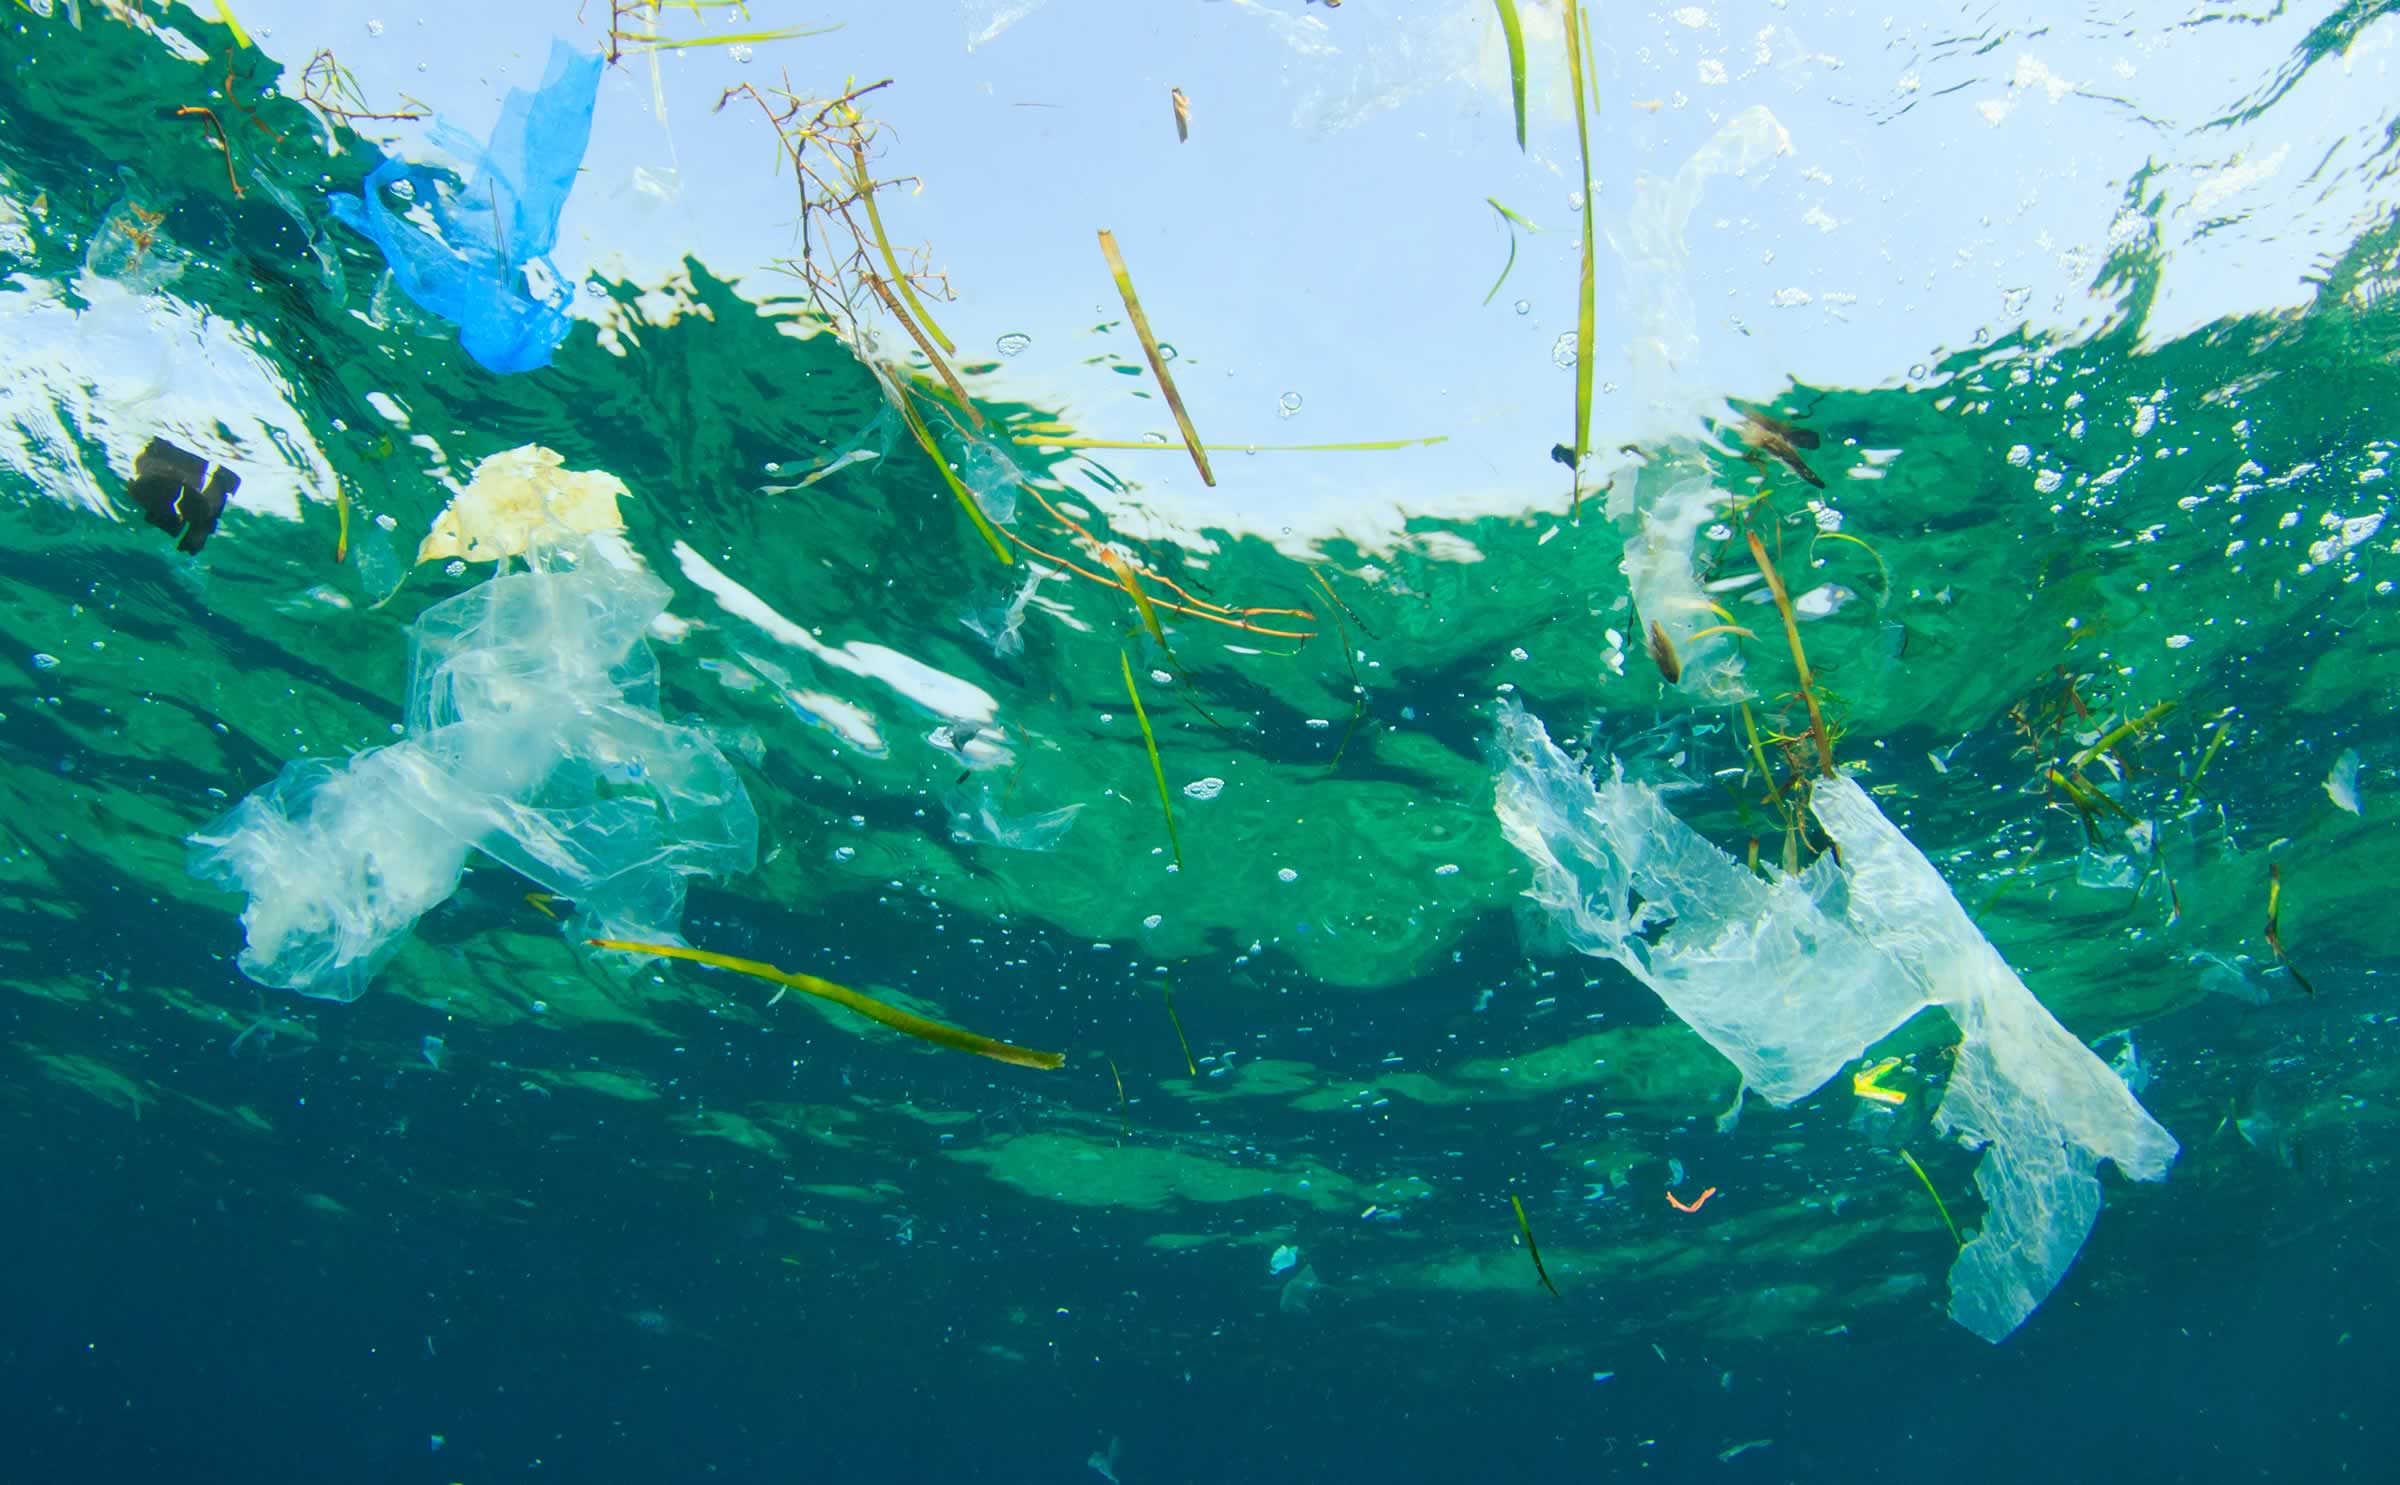
litter — particularly floating plastics
Pollution sources
Pollution enters the Derwent estuary from many sources, commonly referred to as ‘point sources’ and ‘diffuse sources’.
Point sources include sewage treatment plants and large industries, such as the Norske Skog paper mill at Boyer and Nyrstar Hobart zinc smelter at Lutana.
Diffuse sources include stormwater runoff from urban areas as well as the larger catchment inputs carried by the Derwent and Jordan rivers. Other diffuse pollutant sources include air pollution, landfills, aquaculture operations, and wastes associated with ports and marinas. Sediments within the estuary itself may also release pollutants into the overlying waters under certain conditions.
Industry
Industries have historically been the main source of heavy metal pollution to the Derwent, however loads have declined significantly in recent years.
Contaminated groundwater at Nyrstar is now the largest remaining source, and is being captured and treated using a series of innovative projects. In 2017, over 80 tonnes of zinc and other metals were captured, together with nearly all stormwater run-off. The decreased metal load extracted in 2017 compared to 2016 is most likely due to particularly high flow volume processed in 2016.
Groundwater metals recovery (tonnes/year)
Year
Zinc
Cadmium
2012/13
102.8
2.5
2013/14
106.8
1.7
2015
89.8
1.9
2016
148.9
3
2017
84.6
2.5
Sewage
Sewage treatment plants are the largest source of bioavailable nutrients, followed by the catchment, stormwater and the Norske Skog paper mill.
Effluent reuse turns a waste product into valuable, nutrient-enriched irrigation water, removing nutrients that would otherwise enter the Derwent estuary. In 2017, the volume of sewage effluent reused was similar to the previous year and accounts for approximately 20% of the regional sewage generated.
Sewage effluent re-use (tonnes/year)
Year
Bridgewater
Cameron Bay
Macquarie Point
Rokeby
Rosny
Selfs Point
2013
359.5
65.6
117.3
500.3
1702.3
17.4
2014
440.1
39.2
83.6
543.9
892.2
47.0
2015
540.2
50.0
64.6
543.5
1595.5
91.0
2016
444.3
23.7
634.0
1278.7
95.4
2017
632.7
78.1
609.0
1021.2
Pathogens
Pathogens — usually measured indirectly using faecal indicator bacteria — can be derived from overflows or leaks from the sewerage network, as well as animal faeces associated with stormwater and rural run-off. Urban stormwater accounts for the majority of sediment and litter that enter the Derwent, with unmanaged erosion from construction sites a particular concern.
Catchment and Channel
Due to a series of taste and odour issues in drinking water, together with fish kills, and excessive algae growth in the upper estuary, a two-year collaborative catchment monitoring program was initiated by the DEP in cooperation with TasWater, Hydro Tasmania and NRM South. Results are summarised below. In the Channel, the D’Entrecasteaux and Huon Collaboration (supported by the DEP) coordinated a number of marine clean up events and will release their next Report Card summarising monitoring data later in 2018.
River Derwent water quality results
In 2015 a monitoring program was initiated by the DEP, with support from Hydro Tasmania, NRM South and TasWater to monitor nutrients, sediments and other water quality indicators in the fresh water portion of the River Derwent above New Norfolk. Water samples were collected monthly at 14 sites, including at a number of sites last monitored in 1998.
The sites include locations along the River Derwent, between New Norfolk and Wayatinah, as well as at the end of major tributaries, such as the Plenty, Styx, Tyenna, Clyde, Broad, Dee, Ouse and Florentine Rivers. The water quality of the River Derwent in 1998 was excellent however an observed increase in nutrients in the Derwent estuary near New Norfolk, plus the findings of the 2011 River Derwent catchment review, prompted the DEP and other organisations to revisit the monitoring program.
The monitoring revealed that nutrients are predominately derived from aquaculture during summer and from agricultural sources in winter. Water quality across the catchment varied considerably over the two-year sampling period, with lowest nutrient concentrations observed in the upper catchment (below Wayatinah) and Broad River, both of which receive run-off from largely natural, forested catchments.
Elevated dissolved nitrogen and phosphorus levels were observed in both agriculture dominated catchments (e.g. the Ouse, Clyde) and those receiving effluent from large fish hatcheries (e.g. Florentine and Tyenna). Based on the report recommendations, our next steps will involve working with our stakeholders, including representatives of aquaculture and agriculture, to identify immediate actions to reduce nutrients in the river. Read the full report.
Organic matter as biochemical oxygen demand (tonnes/year)
Year
Sewage
Norske Skog Boyer
2013
396
108
2014
367.4
172
2015
404.4
311
2016
590.9
852.6
2017
466.4
356
Did you know?
Effluent reuse increased markedly from the Bridgewater plant in 2017 compared to previous years which has reduced effluent and associated nutrients to the upper estuary (TasWater).
The Derwent Estuary Program is a partnership between state and local government and industry to make the Derwent a world class asset by sharing science for the benefit of nature, the economy and the community.
The DEP ambient and recreational water quality monitoring programs have been operating for 19 years and provide a basis for assessments relating to swimming at beaches, and a whole of estuary health check. Current emphasis includes keeping tabs on dissolved oxygen levels and nutrients in the upper estuary.
Climatic conditions
Rainfall, as measured at the Ellerslie Road (BOM) weather station in Hobart, recorded a slightly wetter than average year. This result is due to more than half the summer rain falling over a three-day period in early December (92 mm), with the wettest December recorded in 23 years. If not for this single event it would have been a significantly drier than average summer. River Derwent flow during summer 2016–17 was the second lowest it had been in 22 years. Flow volume was markedly higher in the summer of 2017–18.
Rainfall in Hobart, Bureau of Meteorology
Month
2017 rainfall (mm)
133 year average (mm)
January
60
47.5
February
10.4
39.5
March
37
44.7
April
21.6
50.3
May
28.4
46.7
June
6.6
53.9
July
37.2
52.4
August
65
53.5
September
46.2
53.2
October
33.4
61.3
November
46.4
54.2
December
101
56.5
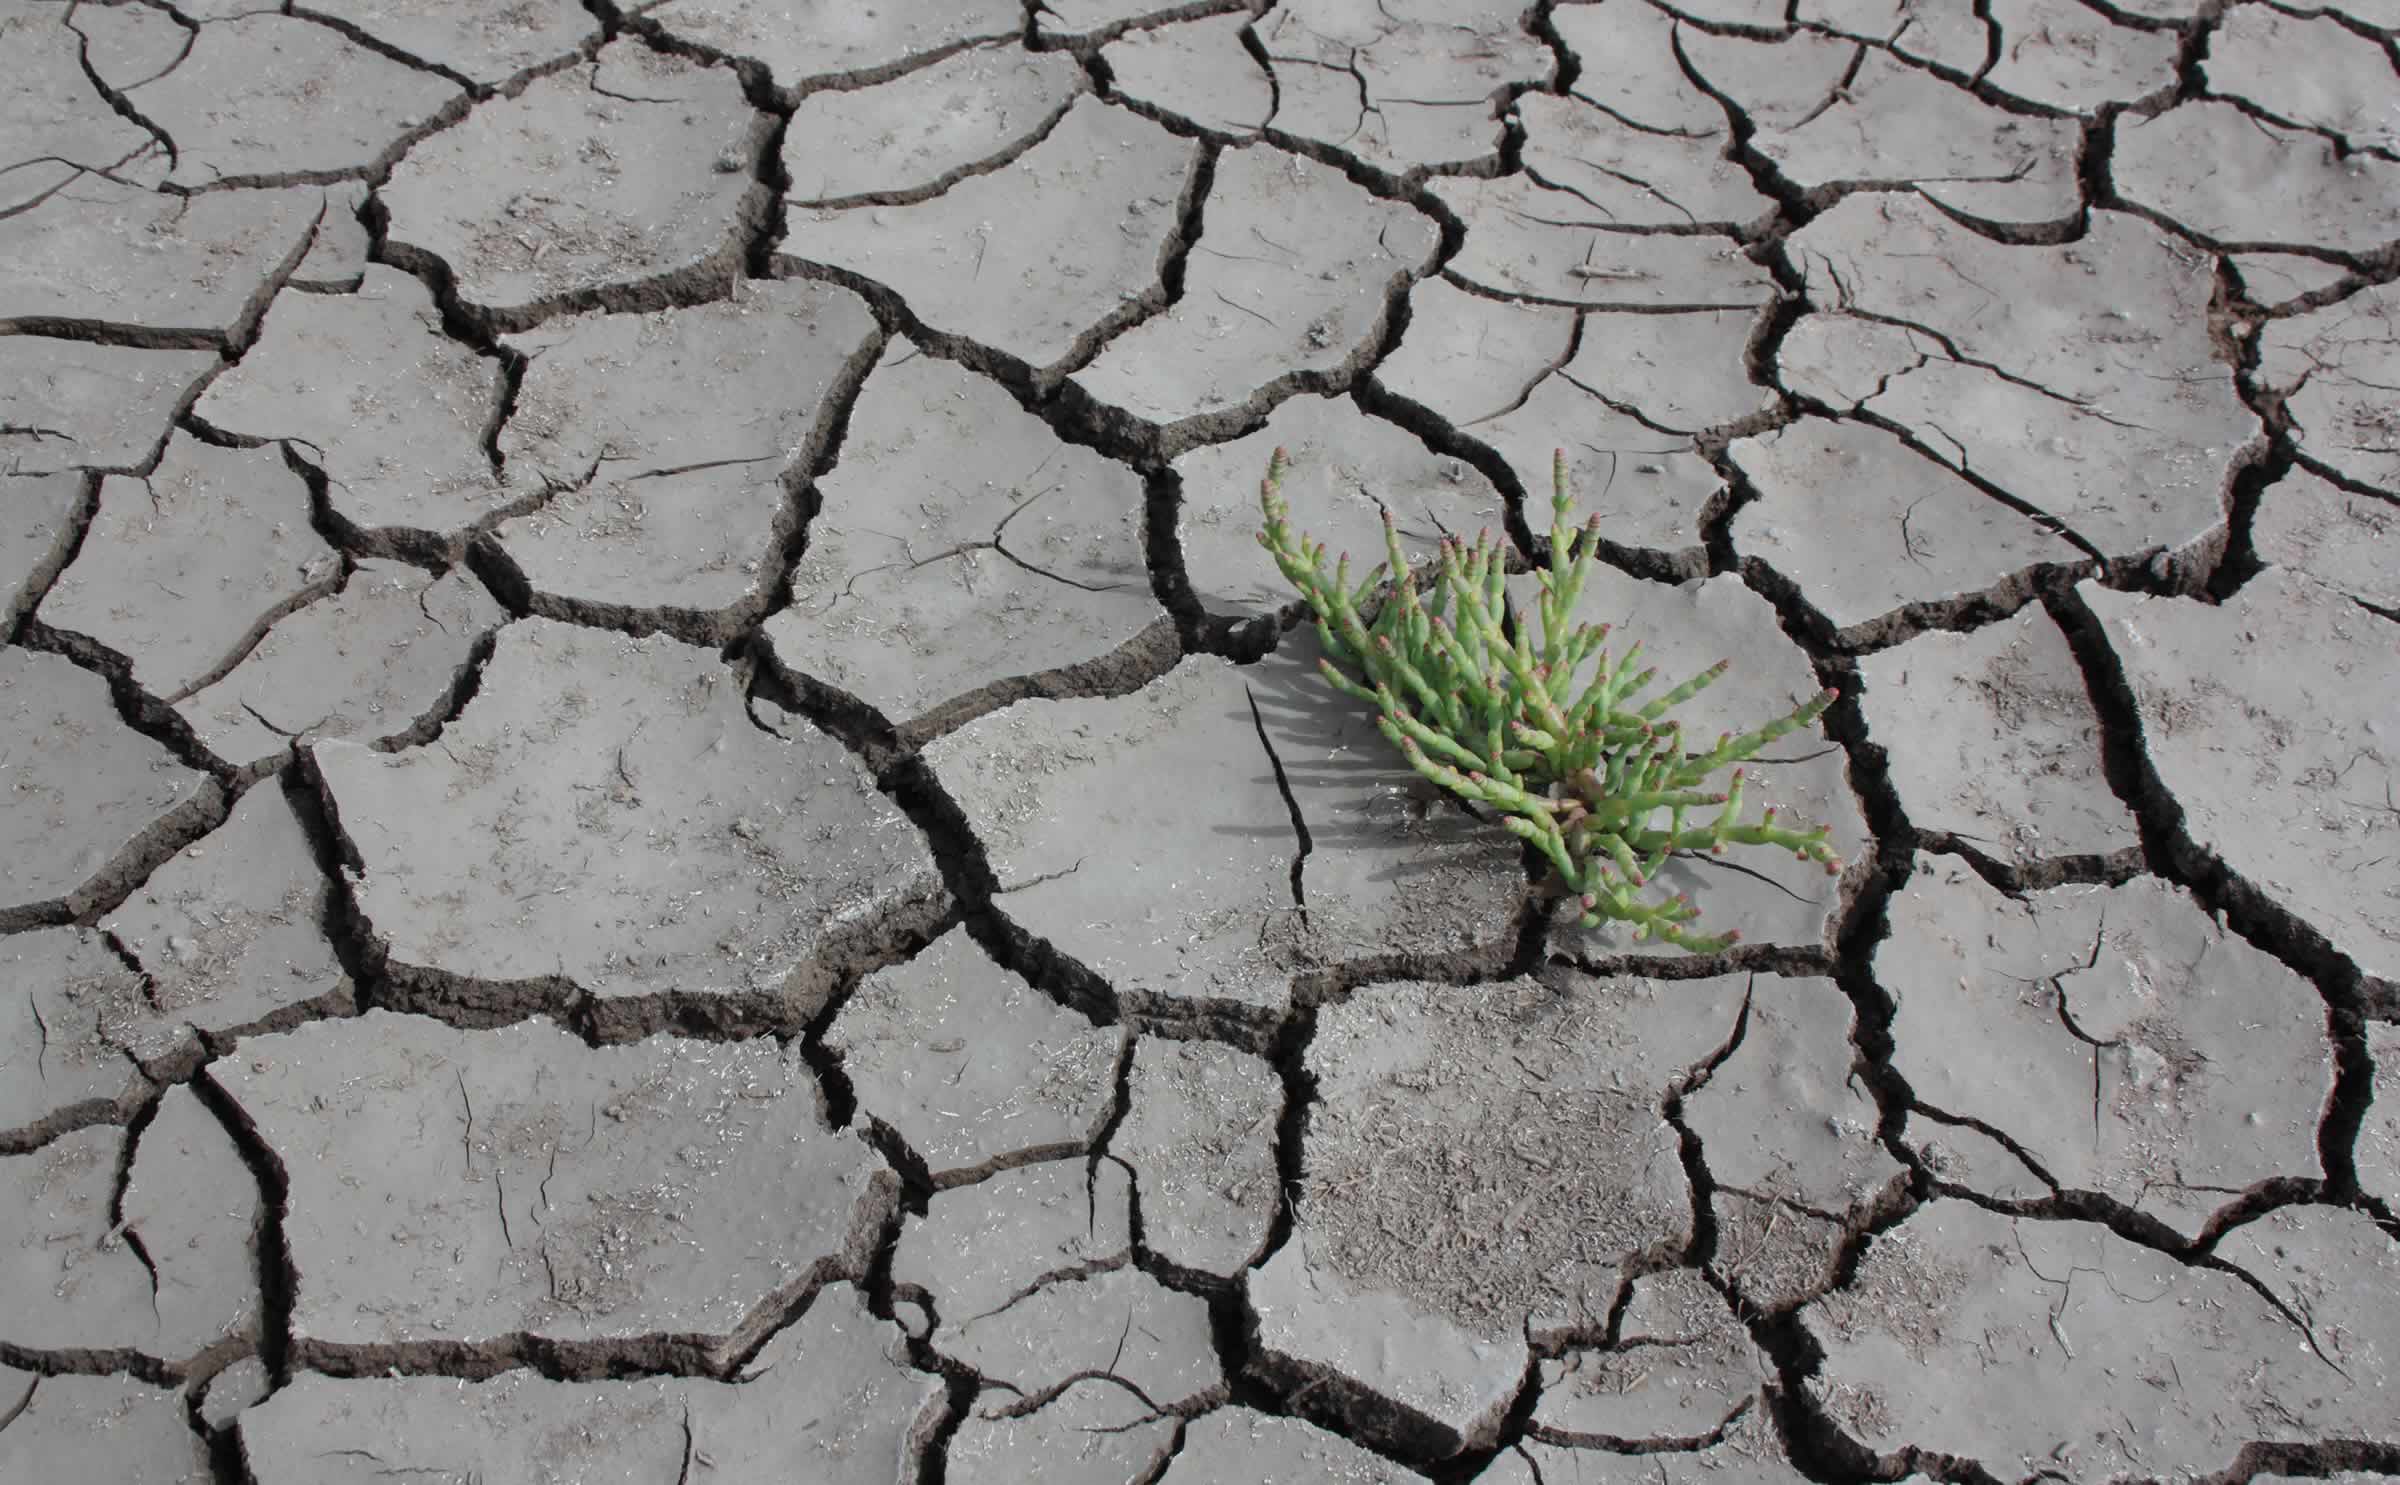
Cracking clay with samphire (Sarcocornia sp.).
Image: Derwent Estuary Program
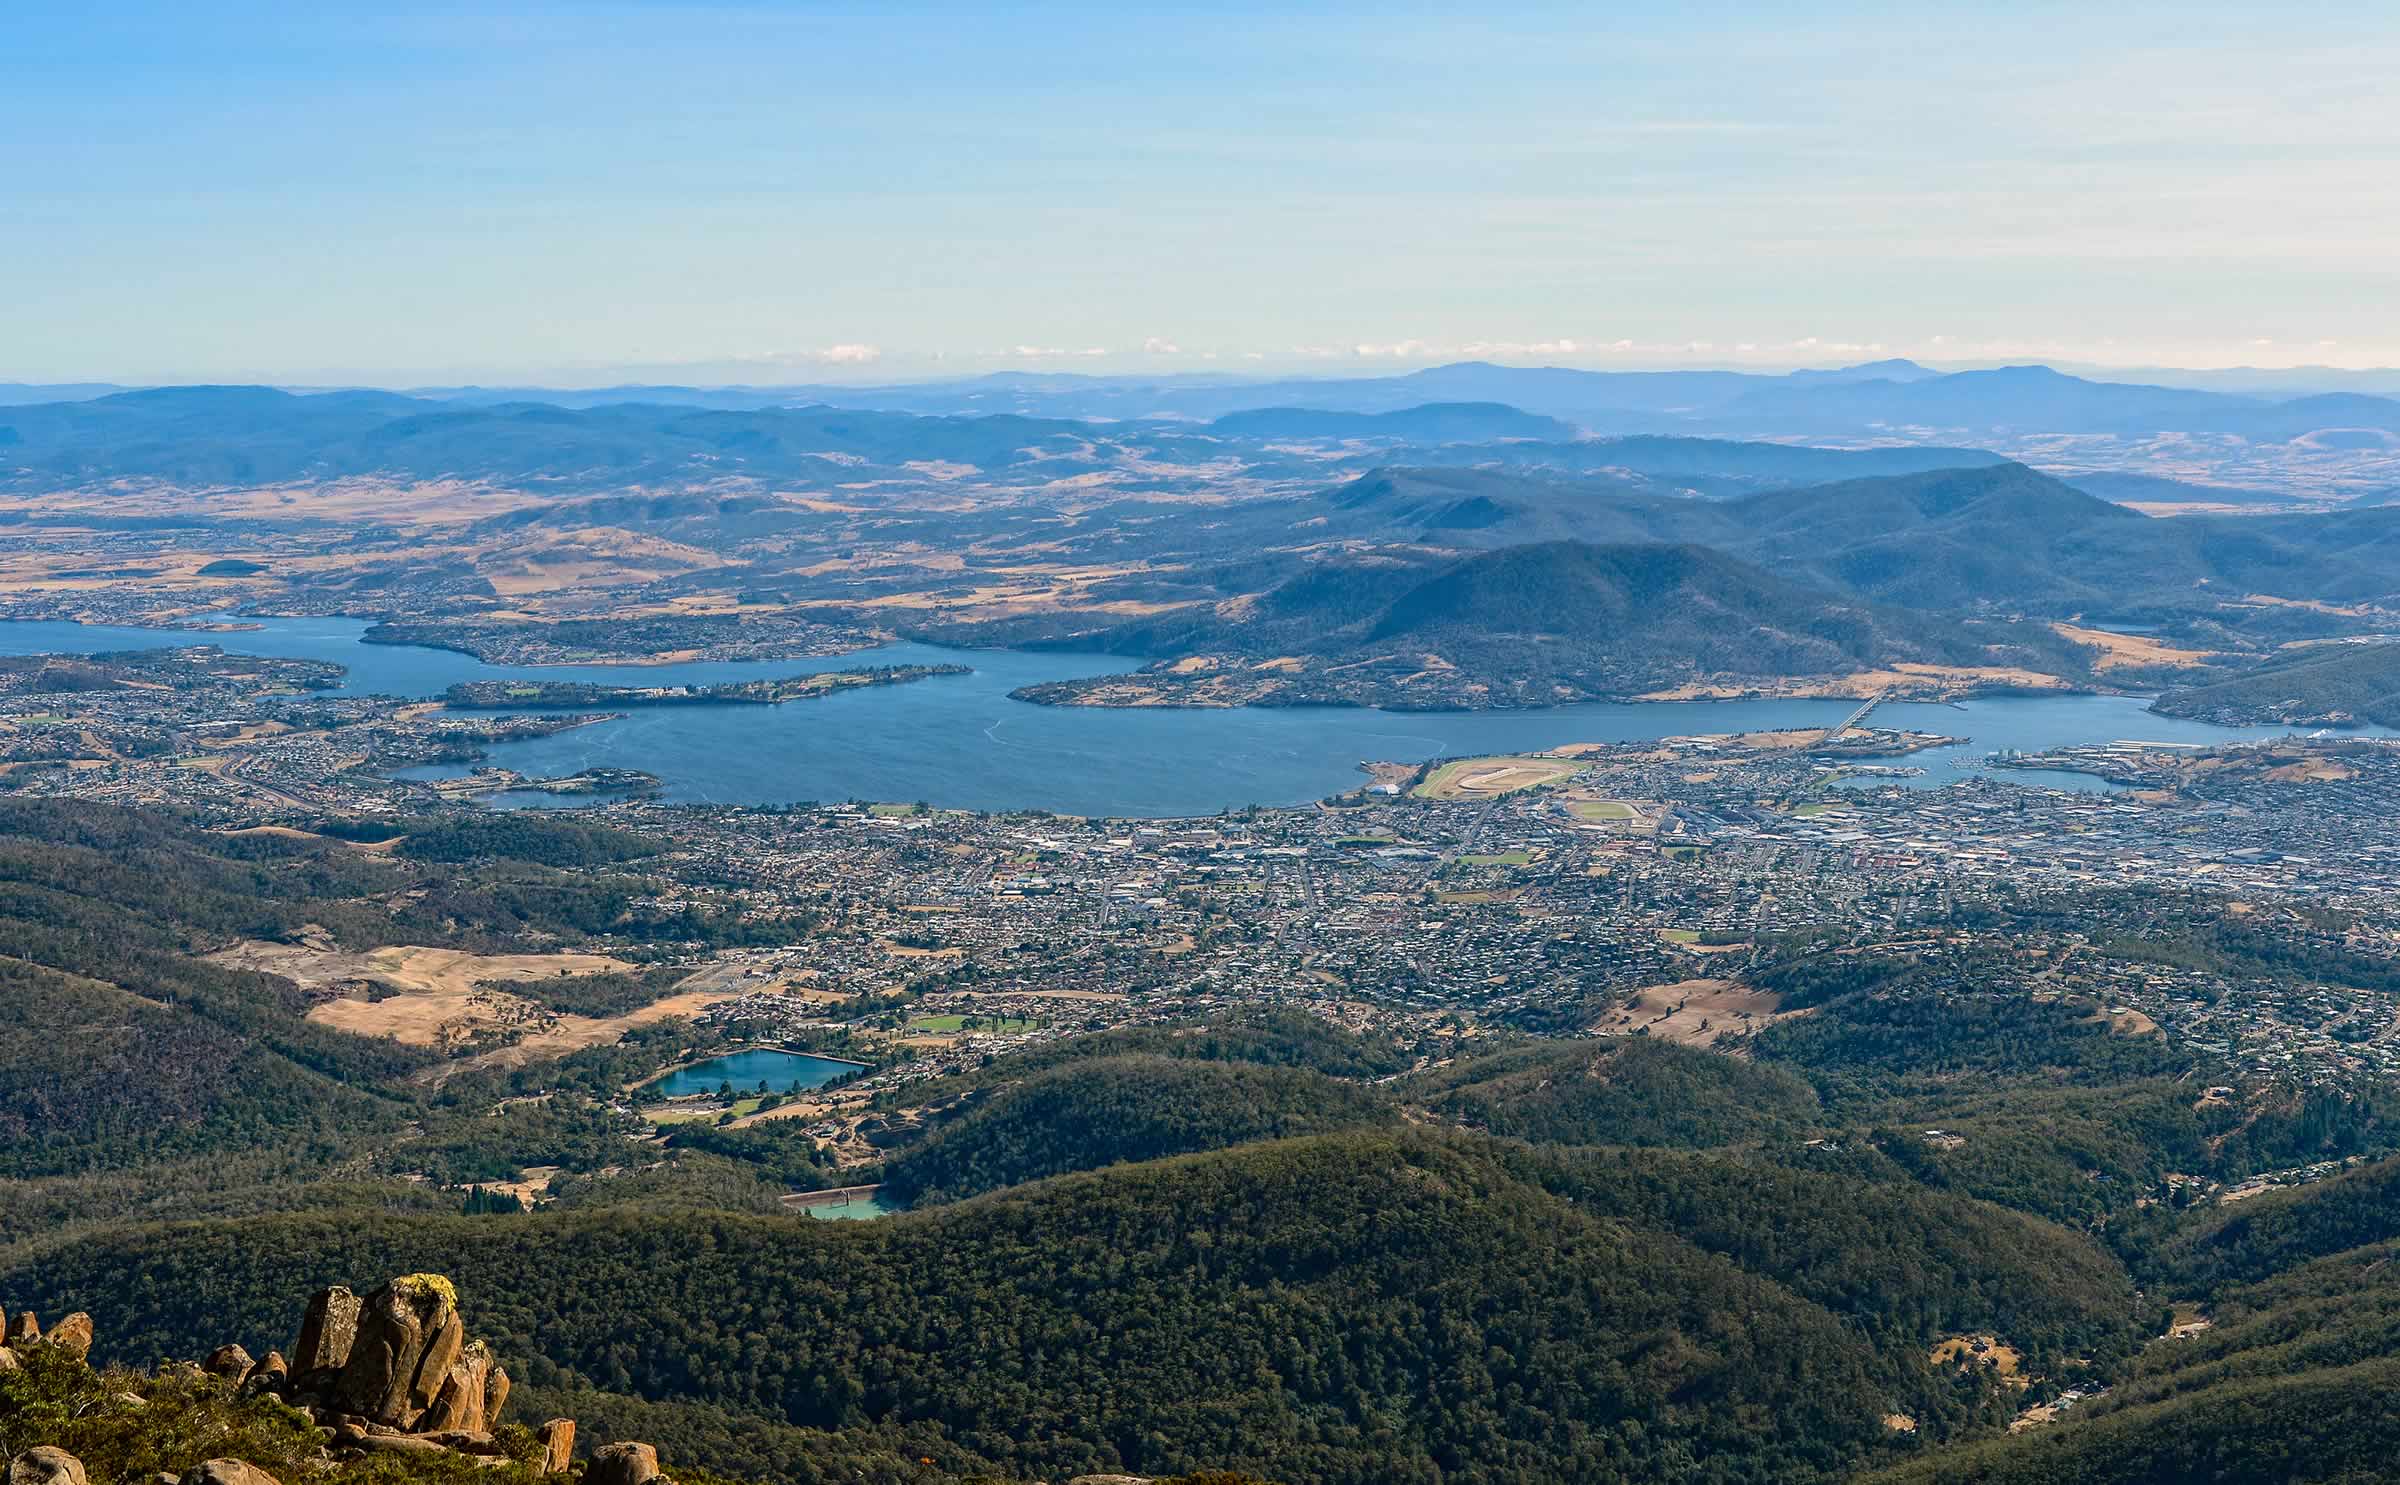
Sandy Bay glimpsed through a break in the clouds from kunanyi / Mount Wellington.
To describe the risk level to swimmers a colour coded system is used based on five years of monitoring data: green indicates good, yellow indicates fair, and red indicates poor water quality.
Thirteen of the Derwent’s eighteen swimming sites are currently classified as having good water quality, four are fair and two are poor. The best water quality sites are at Hinsby, New Norfolk, Little Sandy Bay and Little Howrah. The western end of Nutgrove Beach received a poor rating but extensive pipe work by Hobart City Council and TasWater has seen water quality improve here (see recent management actions for details). Blackmans Bay South was downgraded to a poor rating last season. Extensive efforts to identify the source of contamination are being undertaken by Kingborough council and TasWater. Of the 21 bays, coves and other sites monitored, nine are ranked as good, four less than the previous season. The number of bays with fair water quality increased from three to six, whilst the number of poor bay sites increased from five to six (the mouth of Hobart Rivulet and Browns River, Cornelian Bay and Marieville Esplanade).
Water quality improved at several beach sites in 2017–18 but there was a decline in water quality at some bays. High rainfall accounts for some of the poor results, but not all. It is recommended that sanitary investigations continue to identify and correct sources of faecal contamination. Most urban areas experience poor water quality after heavy rain. Swimming is not recommended in the Derwent for several days after heavy rain and never in the vicinity of stormwater drains or urban rivulets.
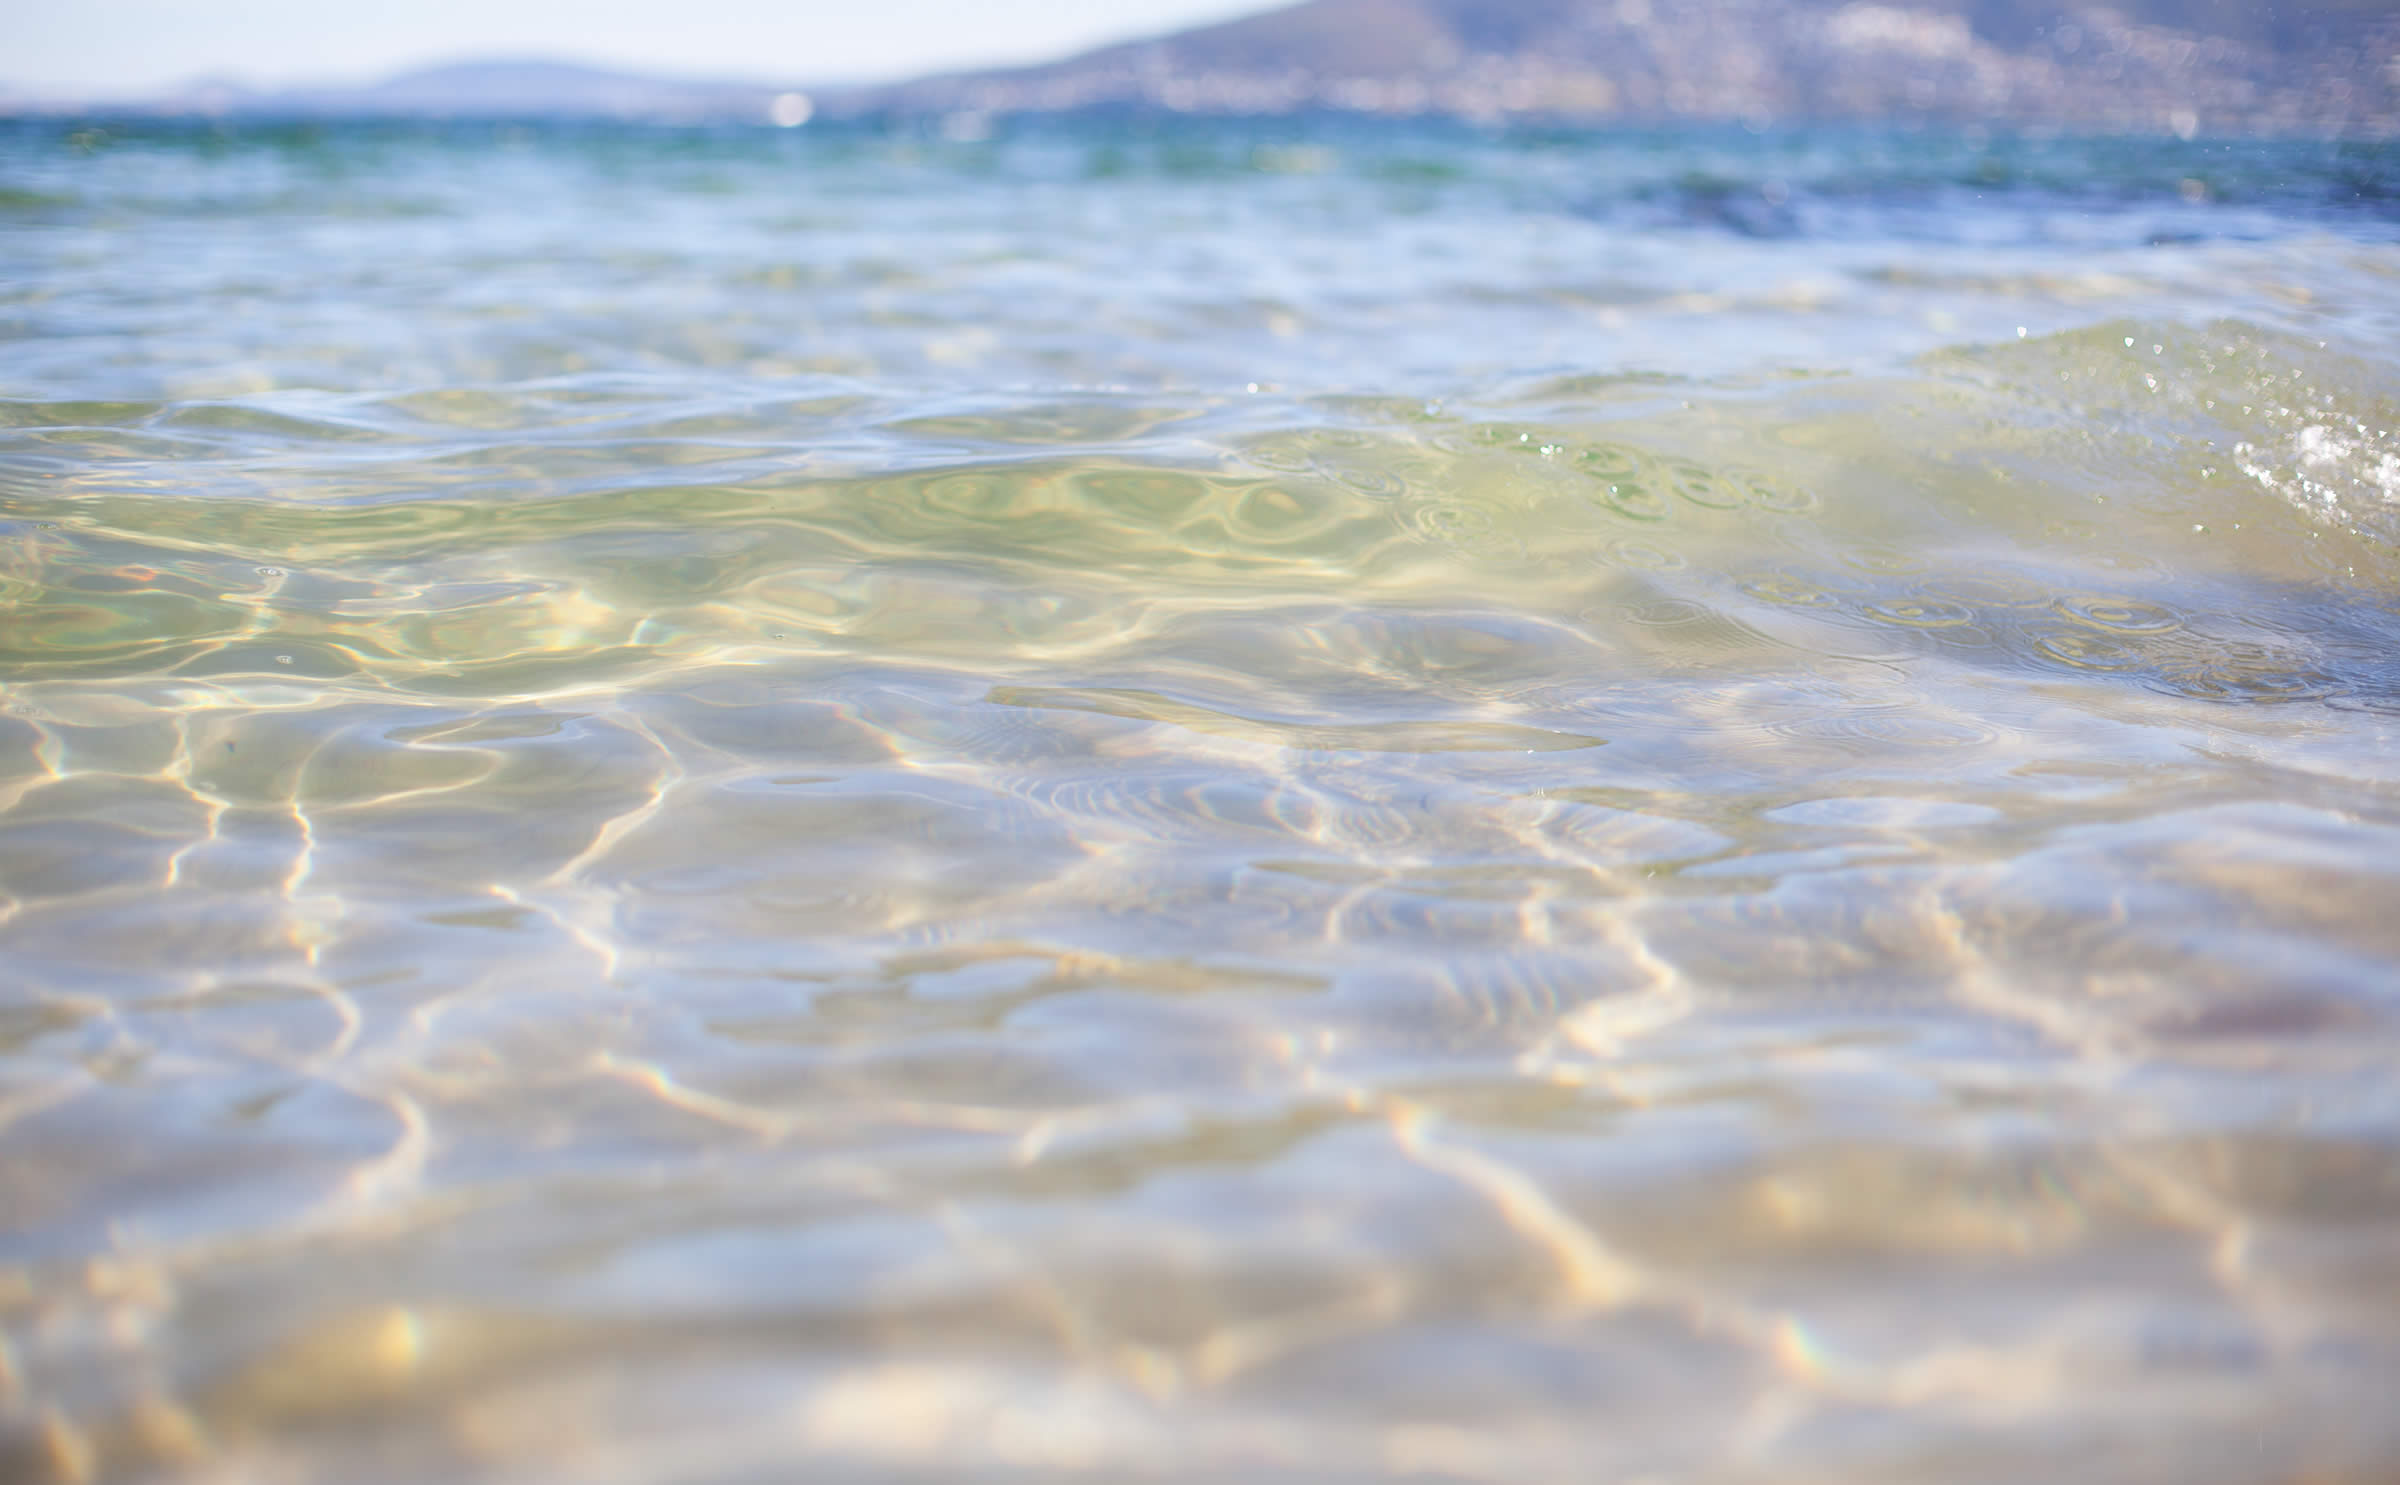
Little Sandy Bay Beach.
Image: Derwent Estuary Program
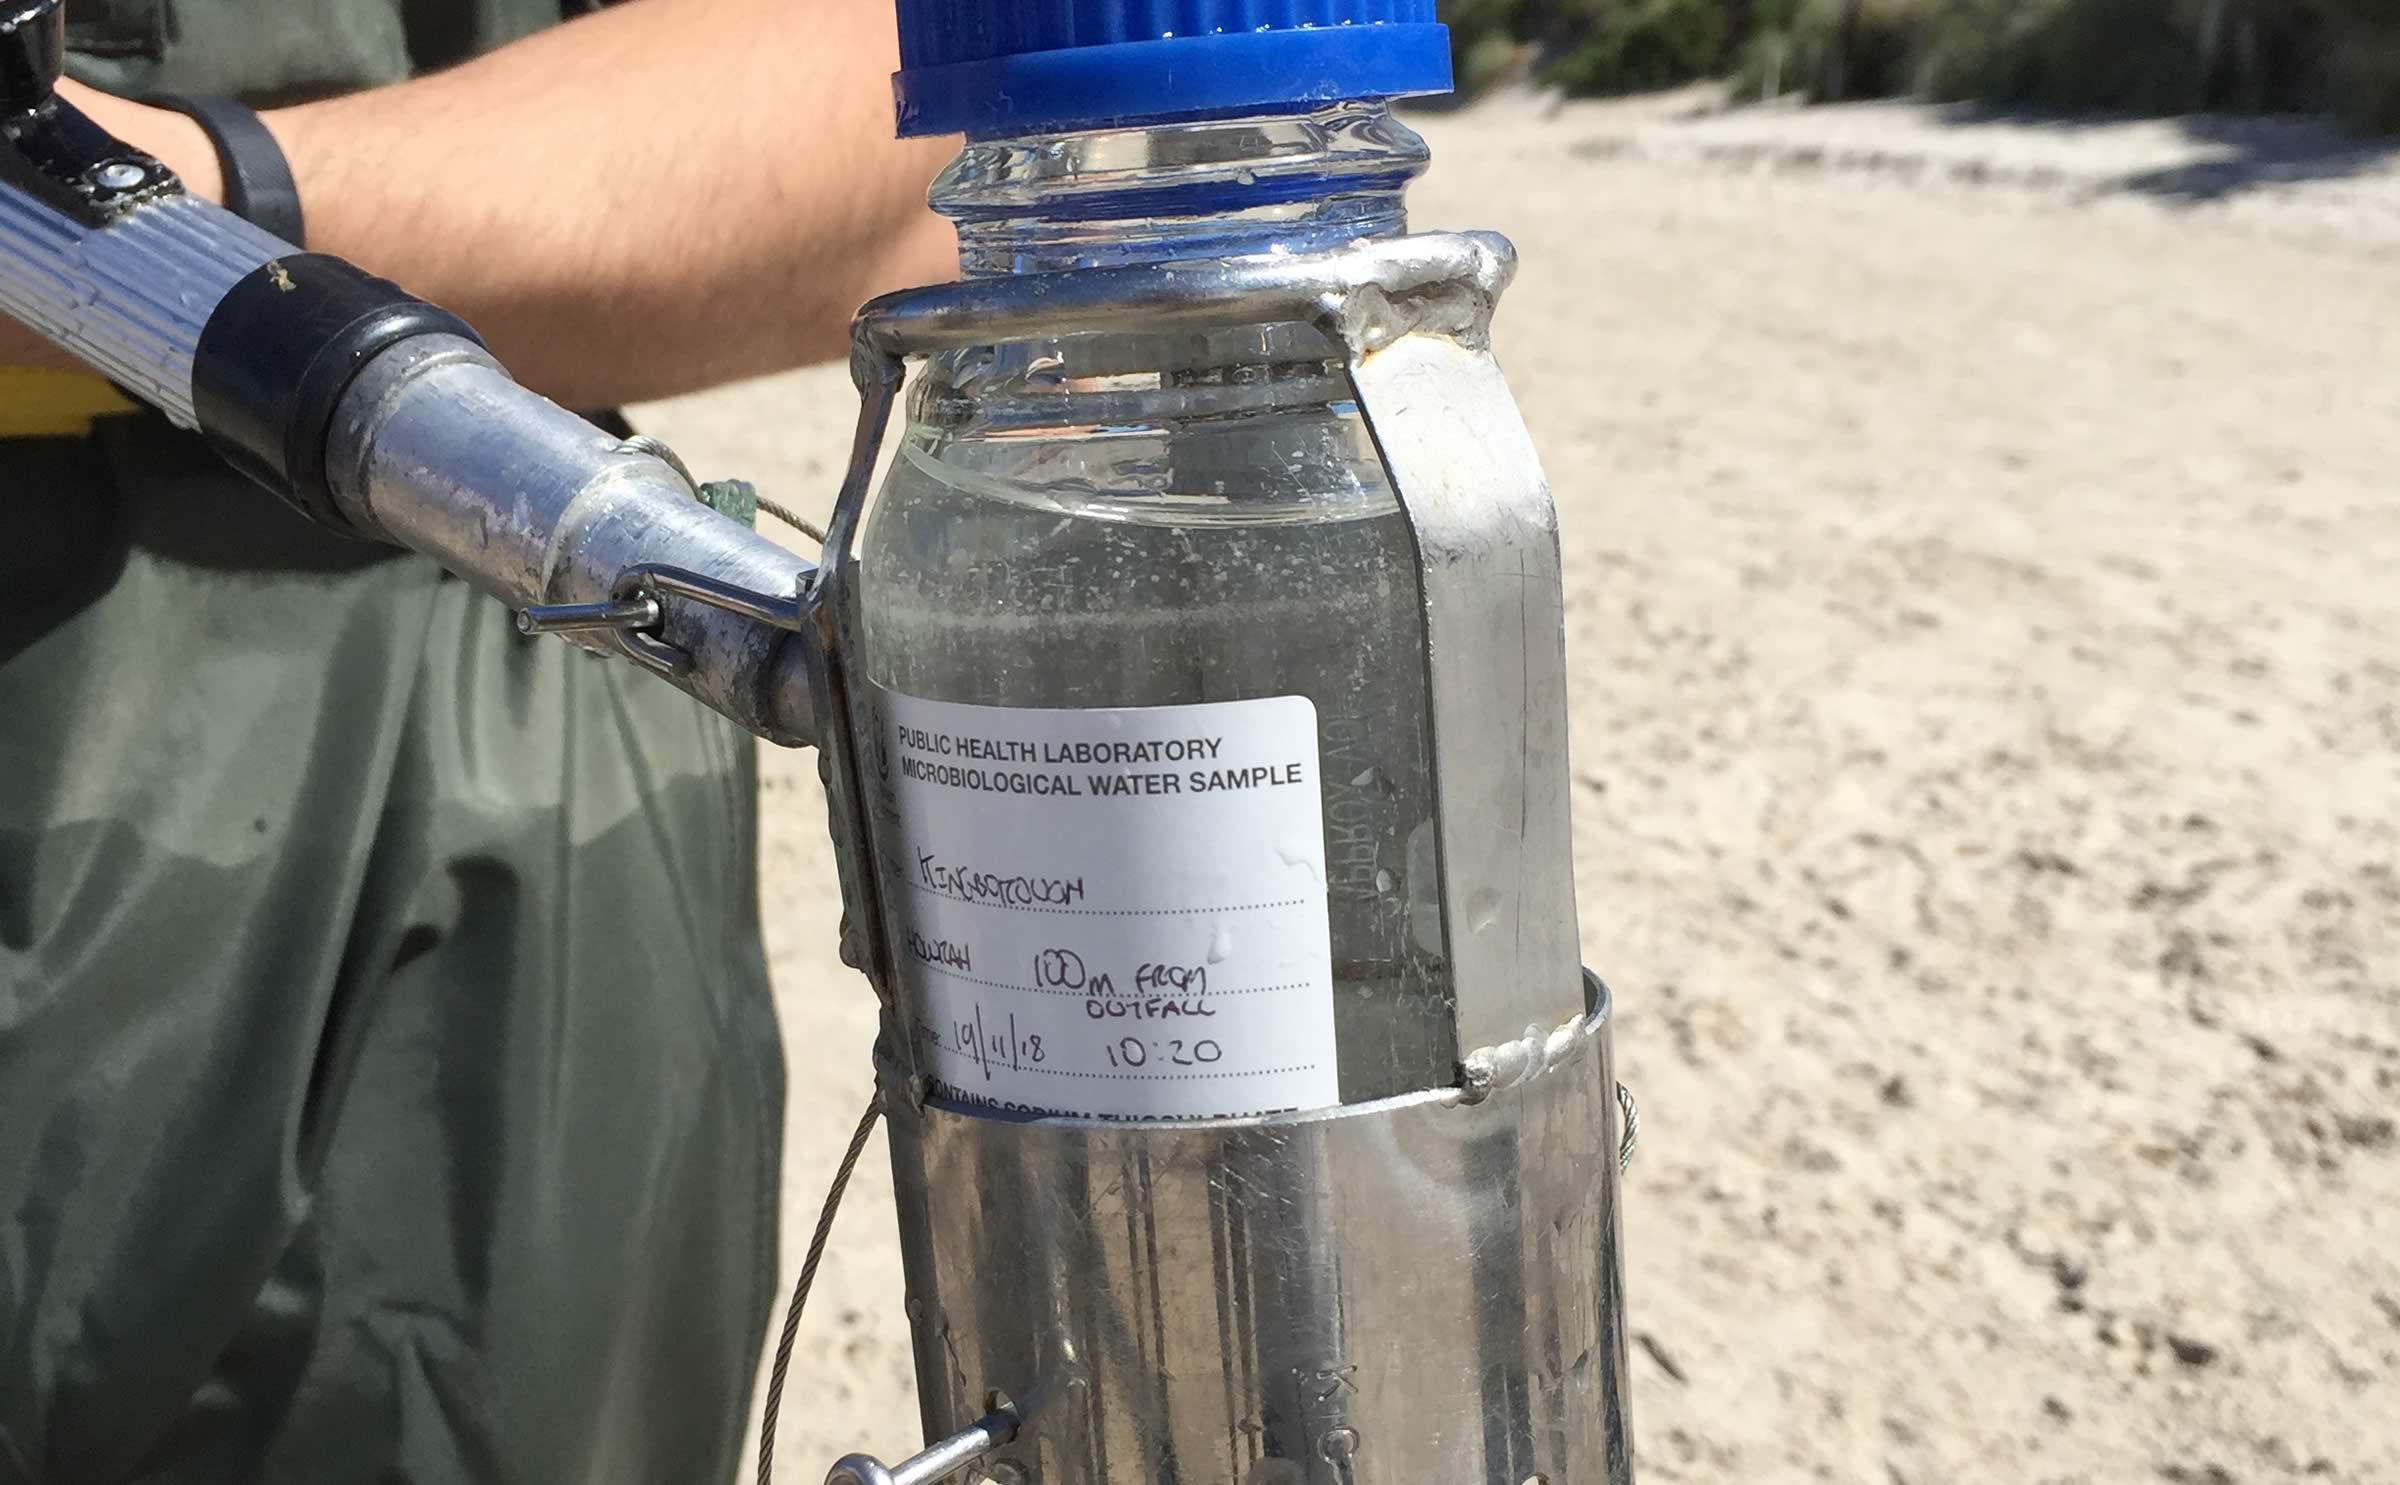
Taking a water sample from the beach.
Image: H. Bobbi, DHHS
Water quality indicators
The DEP coordinates a whole-of-estuary monitoring program that integrates sampling carried out by the DEP and EPA Division, Nyrstar Hobart, Norske Skog and TasWater. Water quality is monitored each month at 27 sites for indicators such as temperature, salinity, dissolved oxygen, suspended solids, nutrients, organic carbon, chlorophyll a and heavy metals. This information is used to document conditions and trends over time and to provide data for estuarine modelling and process studies.
Dissolved oxygen levels in the Derwent are generally high except periodically in the area between Bridgewater and New Norfolk. During summer months when water temperatures are high and river flows are low, the deeper channels in this area tend to be oxygen poor, with adverse impacts on bottom-dwelling organisms and some species of fish. Low oxygen levels can also result in the release of nutrients and heavy metals from underlying sediments. Dissolved oxygen was again very low in bottom waters of the upper Derwent estuary in summer/ autumn 2016–17 and 2017–18, but hypoxia (oxygen deficiency) was not as severe at New Norfolk in 2017–18 compared to 2016–17.
2017 dissolved oxygen levels at New Norfolk (at depth)
Month
Dissolved oxygen (% saturation)
January
11.8
February
33
March
20.4
April
22.1
May
32
June
42.3
July
54.5
August
96.3
September
98.2
October
100
November
38.3
December
93.6
Seagrass health update
The extensive meadows of aquatic plants in the upper Derwent estuary are showing signs of stress due to human population pressures. Their decline is a problem as seagrass assists with nutrient removal, sediment stabilisation, as well as providing food and habitat for birds, fish and crabs.
The principal factors restricting the health of this habitat are light, temperature, nutrients and salinity. Although all plants require some amount of nutrients, algae is quicker to respond to elevated nutrients than the longer-lived and slower growing seagrass, and can grow so densely that the underlying seagrass cannot get enough light to survive or reproduce.
Between spring 2015 and autumn 2017, seagrass condition severely declined and in areas known to support seagrass, it covered just 10% of that area, with the remaining 90% consisting of either bare substrate, or a dense smothering of green algae. However, in the spring/summer of 2017–18, seagrass recovered without the expected increase in algal smothering. By early autumn 2018, approximately 60% of this area had returned to seagrass. In Herdsman’s Cove at the mouth of the Jordan River, seagrass cover increased to 37%, up from 2%. The observed improvement provides an excellent opportunity to identify potentially related environmental changes.
Contaminated sediments
Levels of heavy metals in Derwent estuary sediments are among the highest in Australia. Derwent sediments tend to be fine-grained and organic-rich and significantly exceed national sediment quality guidelines for zinc, copper, mercury, lead, cadmium and arsenic.
The most recent survey (2012) confirmed that metal levels are highest in the mid estuary and at depth, with some slight improvements observed in a few areas.
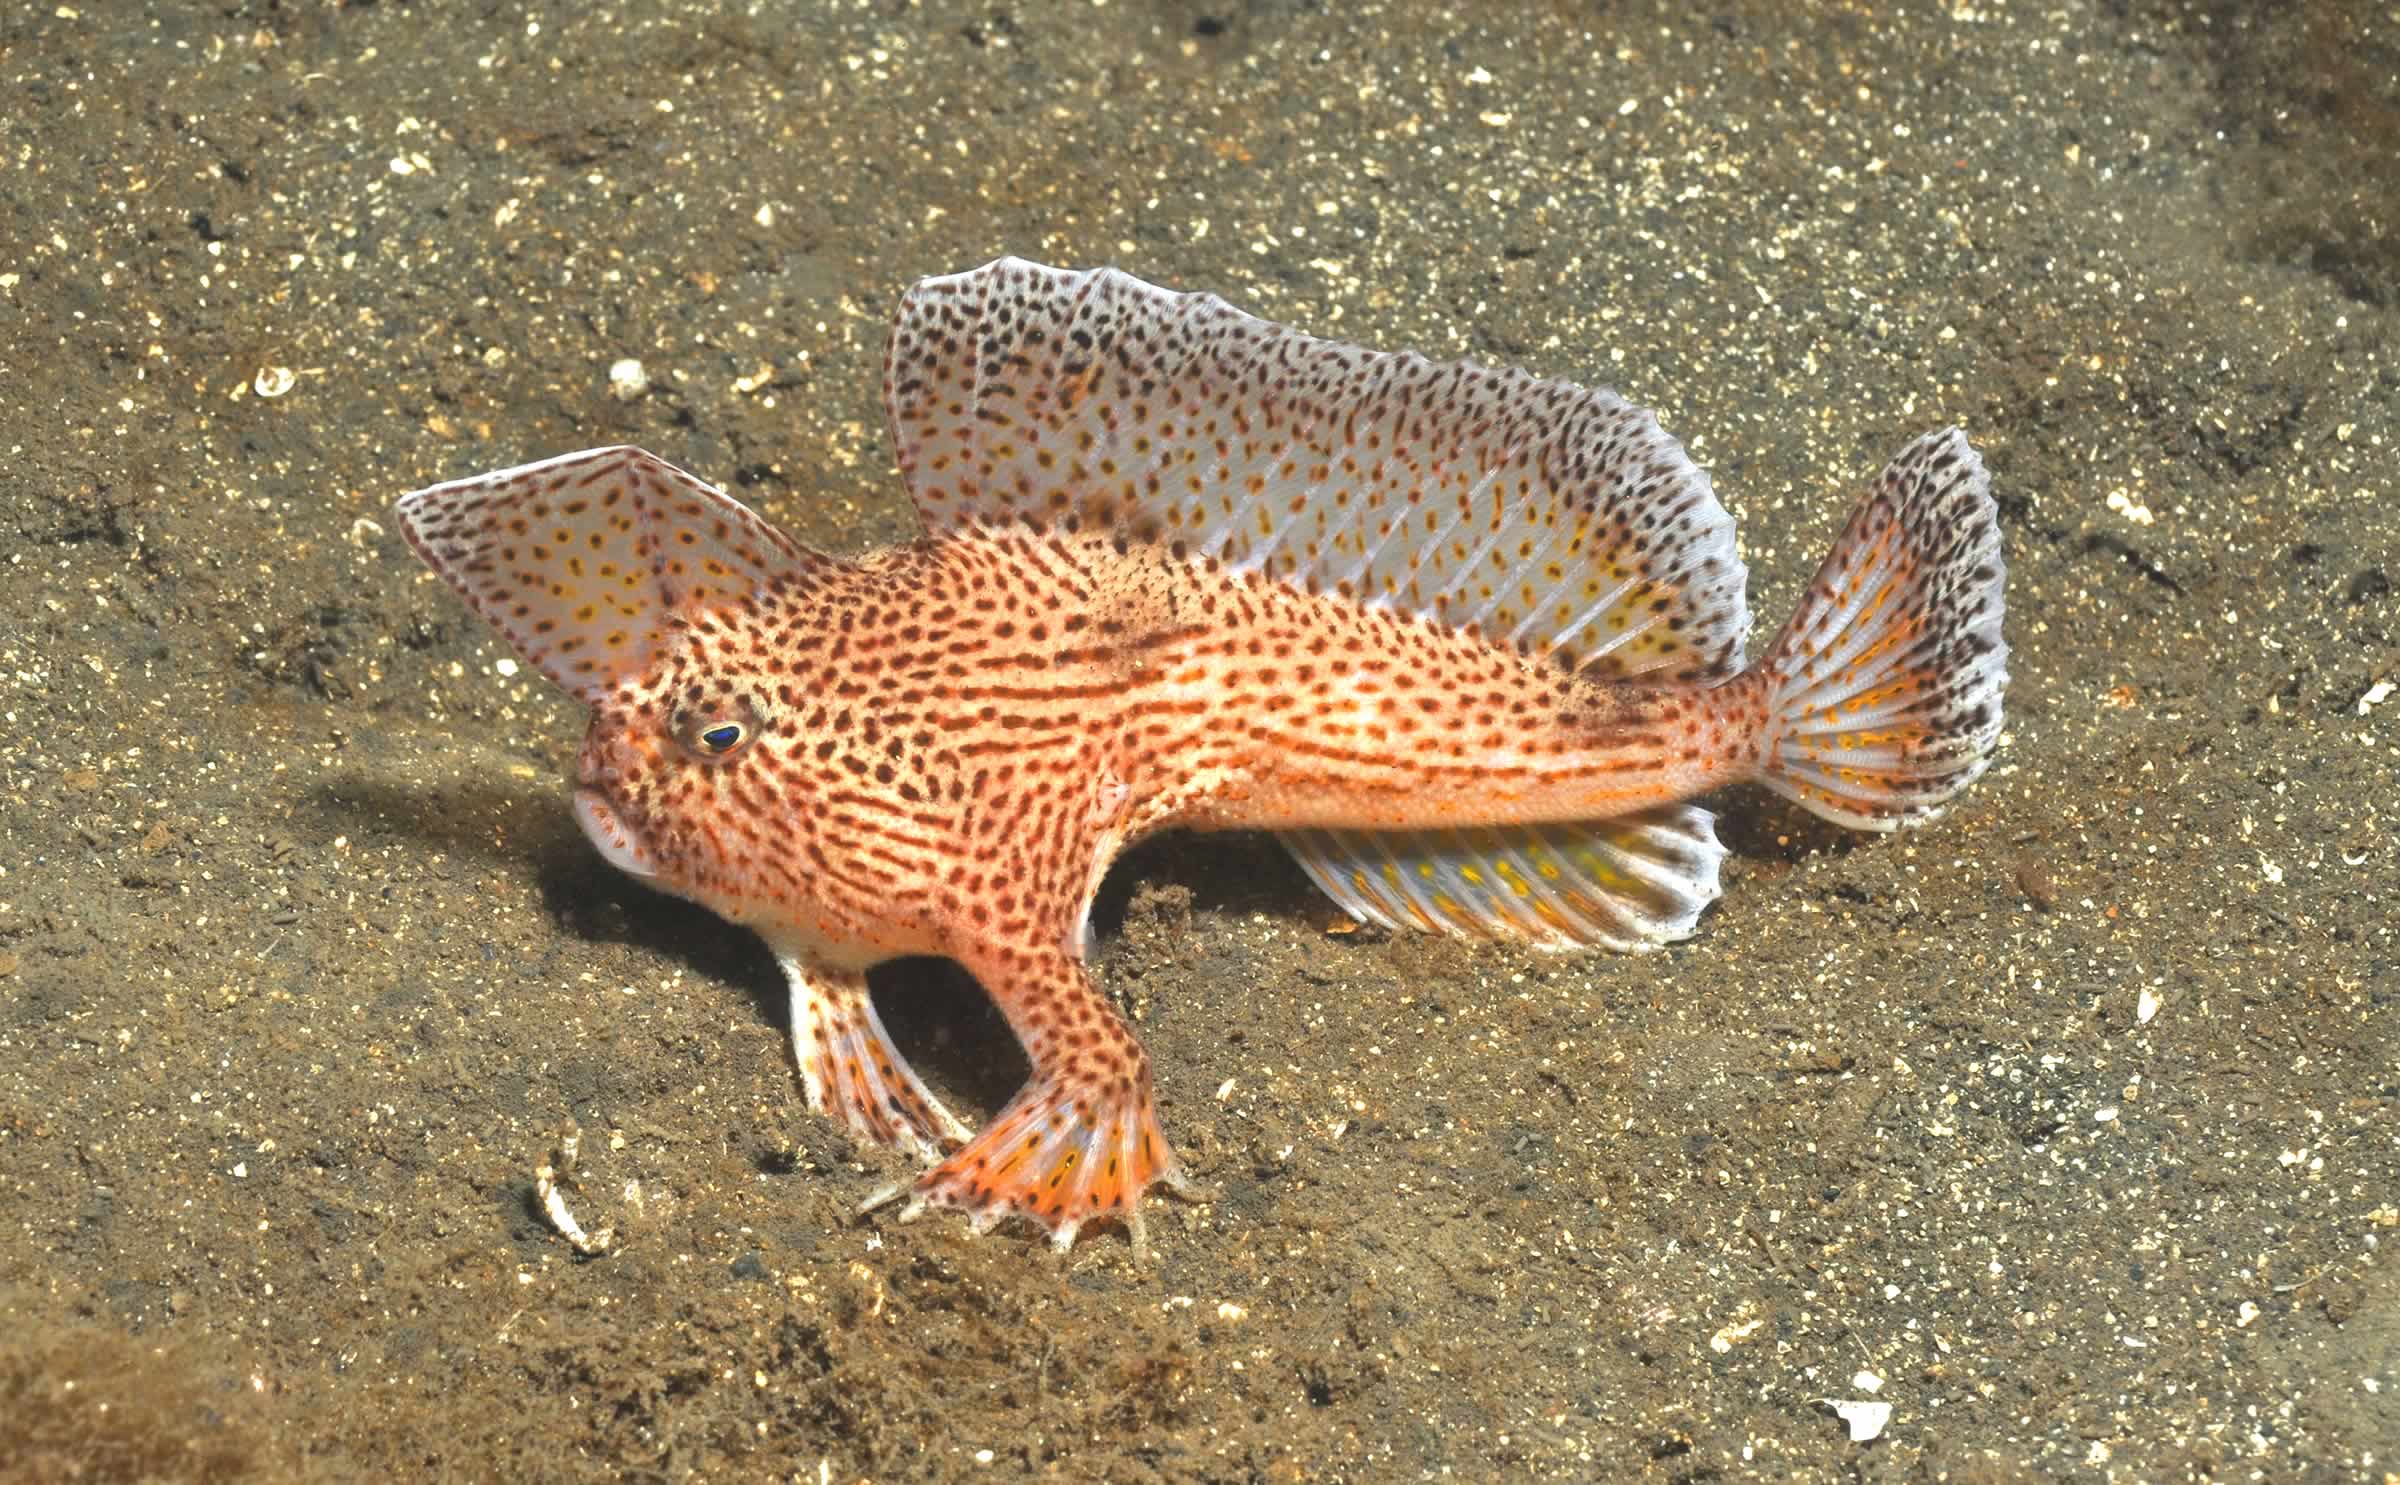
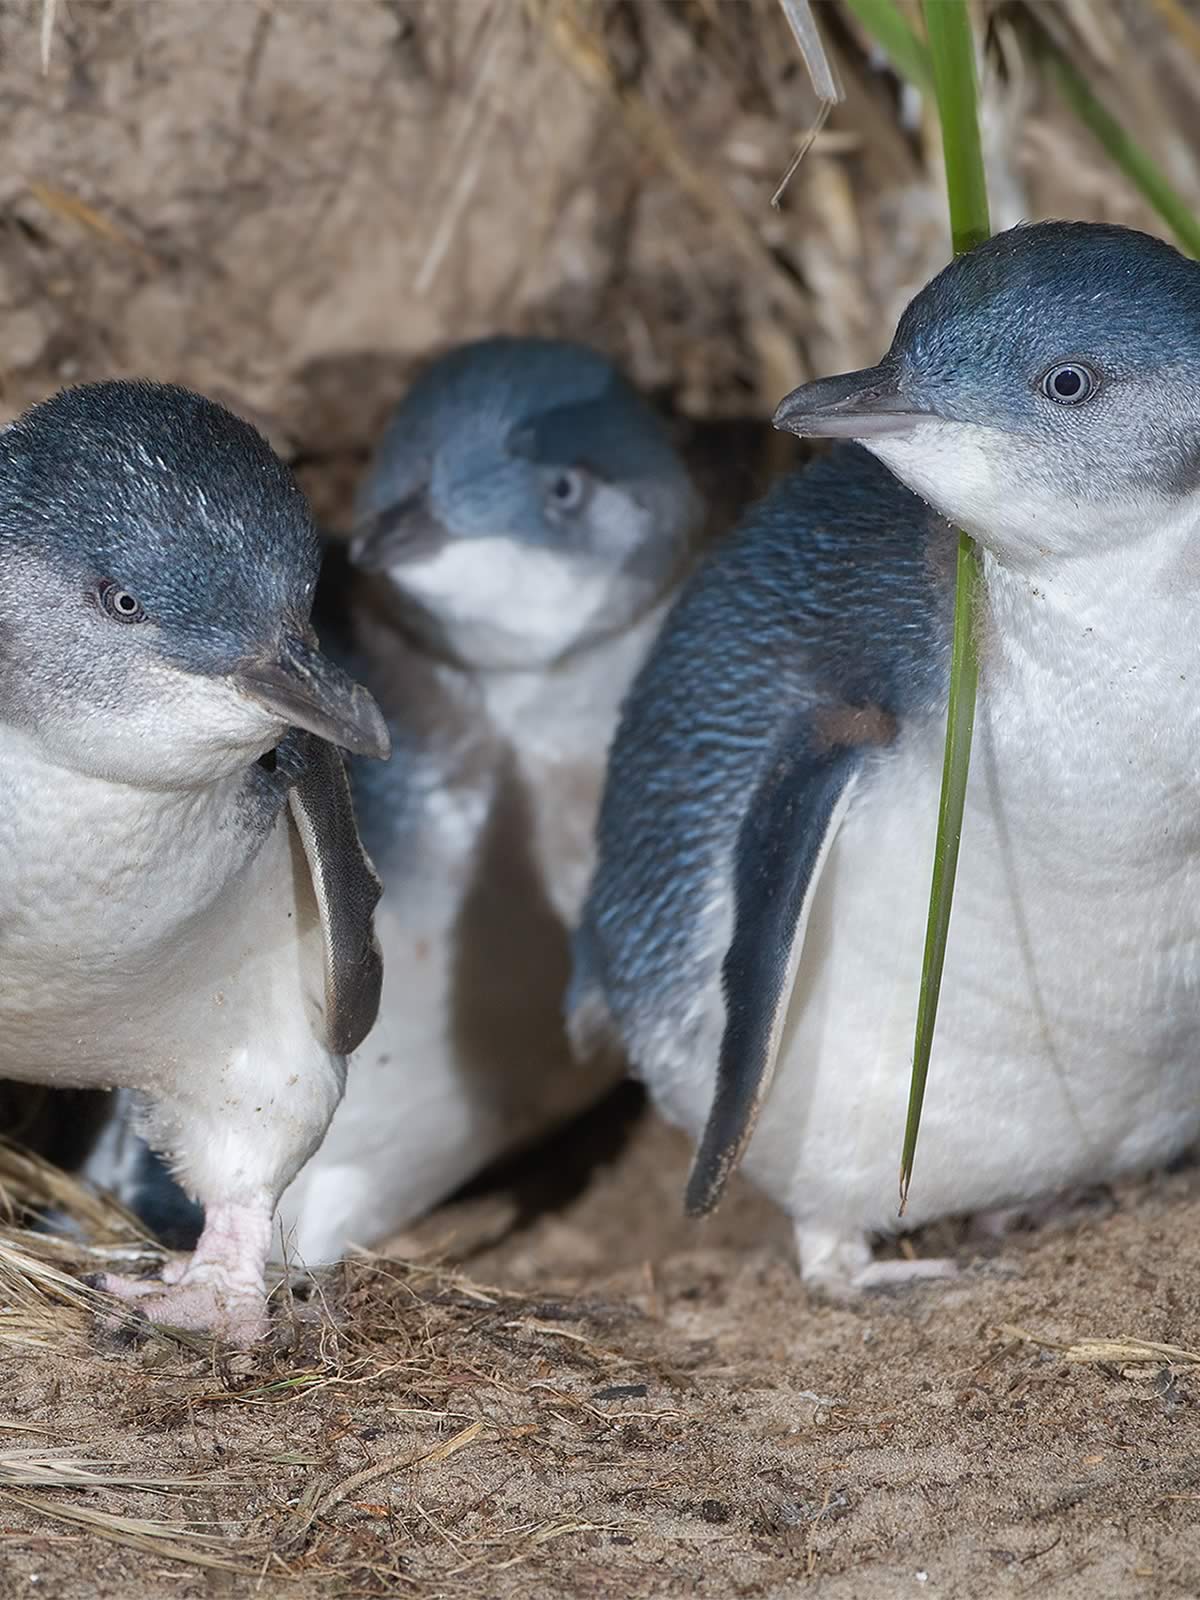
Important habitats of the Derwent include rocky reefs, saltmarshes and wetlands. The Derwent is also home to huge numbers of plants and animals. Two of note are the spotted handfish and the little penguin and their conservation is supported by the DEP in cooperation with local councils, scientists, State Government and the community. Human health is a key reporting priority for the DEP, particularly heavy metal levels in fish and shellfish.
Estuarine habitat and species
Surveys of the Derwent estuary indicate that unvegetated, soft-bottom habitats are by far the most abundant habitats in the estuary (86%), followed by seagrass and macrophytes (7%; primarily in the upper estuary), tidal sandflats (6%; primarily in Ralphs Bay) and rocky reefs (1%; primarily in the lower estuary). Detailed surveys by the CSIRO of nine Derwent estuary spotted handfish colonies were carried out again in 2017 using a new survey method. The number of handfish have declined and no handfish were observed in Ralphs Bay. Numbers of juvenile fish at all sites are critically low. A captive breeding program has been initiated and this is a promising step with fish breeding at Seahorse World in Tasmania, the CSIRO and at the Melbourne aquarium. In the Derwent, artificial spawning substrates (made of ceramic) have been planted out at key sites to improve breeding success. The use of eco-moorings for boats better protects the seafloor and a small number have been installed at boat and yacht clubs in Sandy Bay which will help improve spotted handfish habitat.
Spotted handfish.
Image: Rick Stuart-Smith
In 2018 the Handfish Conservation Project was established where all donations received will be used to support research to prevent these critically endangered fish becoming extinct.
Oysters and mussels from the Derwent contain high levels of heavy metals, particularly zinc, lead and cadmium. While levels appear to have declined since 2003 in some areas (i.e. above the Tasman Bridge), they are still far in excess of national food standards. Mercury levels exceed national food standards in several species of Derwent caught fish — particularly black bream — and to a lesser degree flathead and trout.
Limited sampling suggests that levels are lower in other recreationally-targeted fish (e.g. whiting, Australian salmon, mullet, cod and flounder). Based on the most recent (2017) monitoring results for flathead, oysters and mussels, there has been no change in current health advice, which is as follows:
Don’t eat shellfish collected from the Derwent (including Ralphs Bay)
Don’t eat any bream from the Derwent (including Browns River)
Limit consumption of other Derwent-caught fish to no more than 2 meals/week, or 1 meal/week for pregnant and breastfeeding women, women planning to become pregnant and young children
The seafood safety survey to assess recreationally targeted fish (other than flathead) will be repeated in 2019.
Marine pests, weeds and disease
The Derwent estuary is extensively colonised by introduced marine species. At least 79 invasive species have been recorded, including four species of particular national concern: northern Pacific seastar, European green crab, Japanese seaweed, and European clam. A number of other species (e.g. New Zealand half crab, New Zealand seastar, and New Zealand screw shell) also pose a significant threat to the ecology of the estuary.
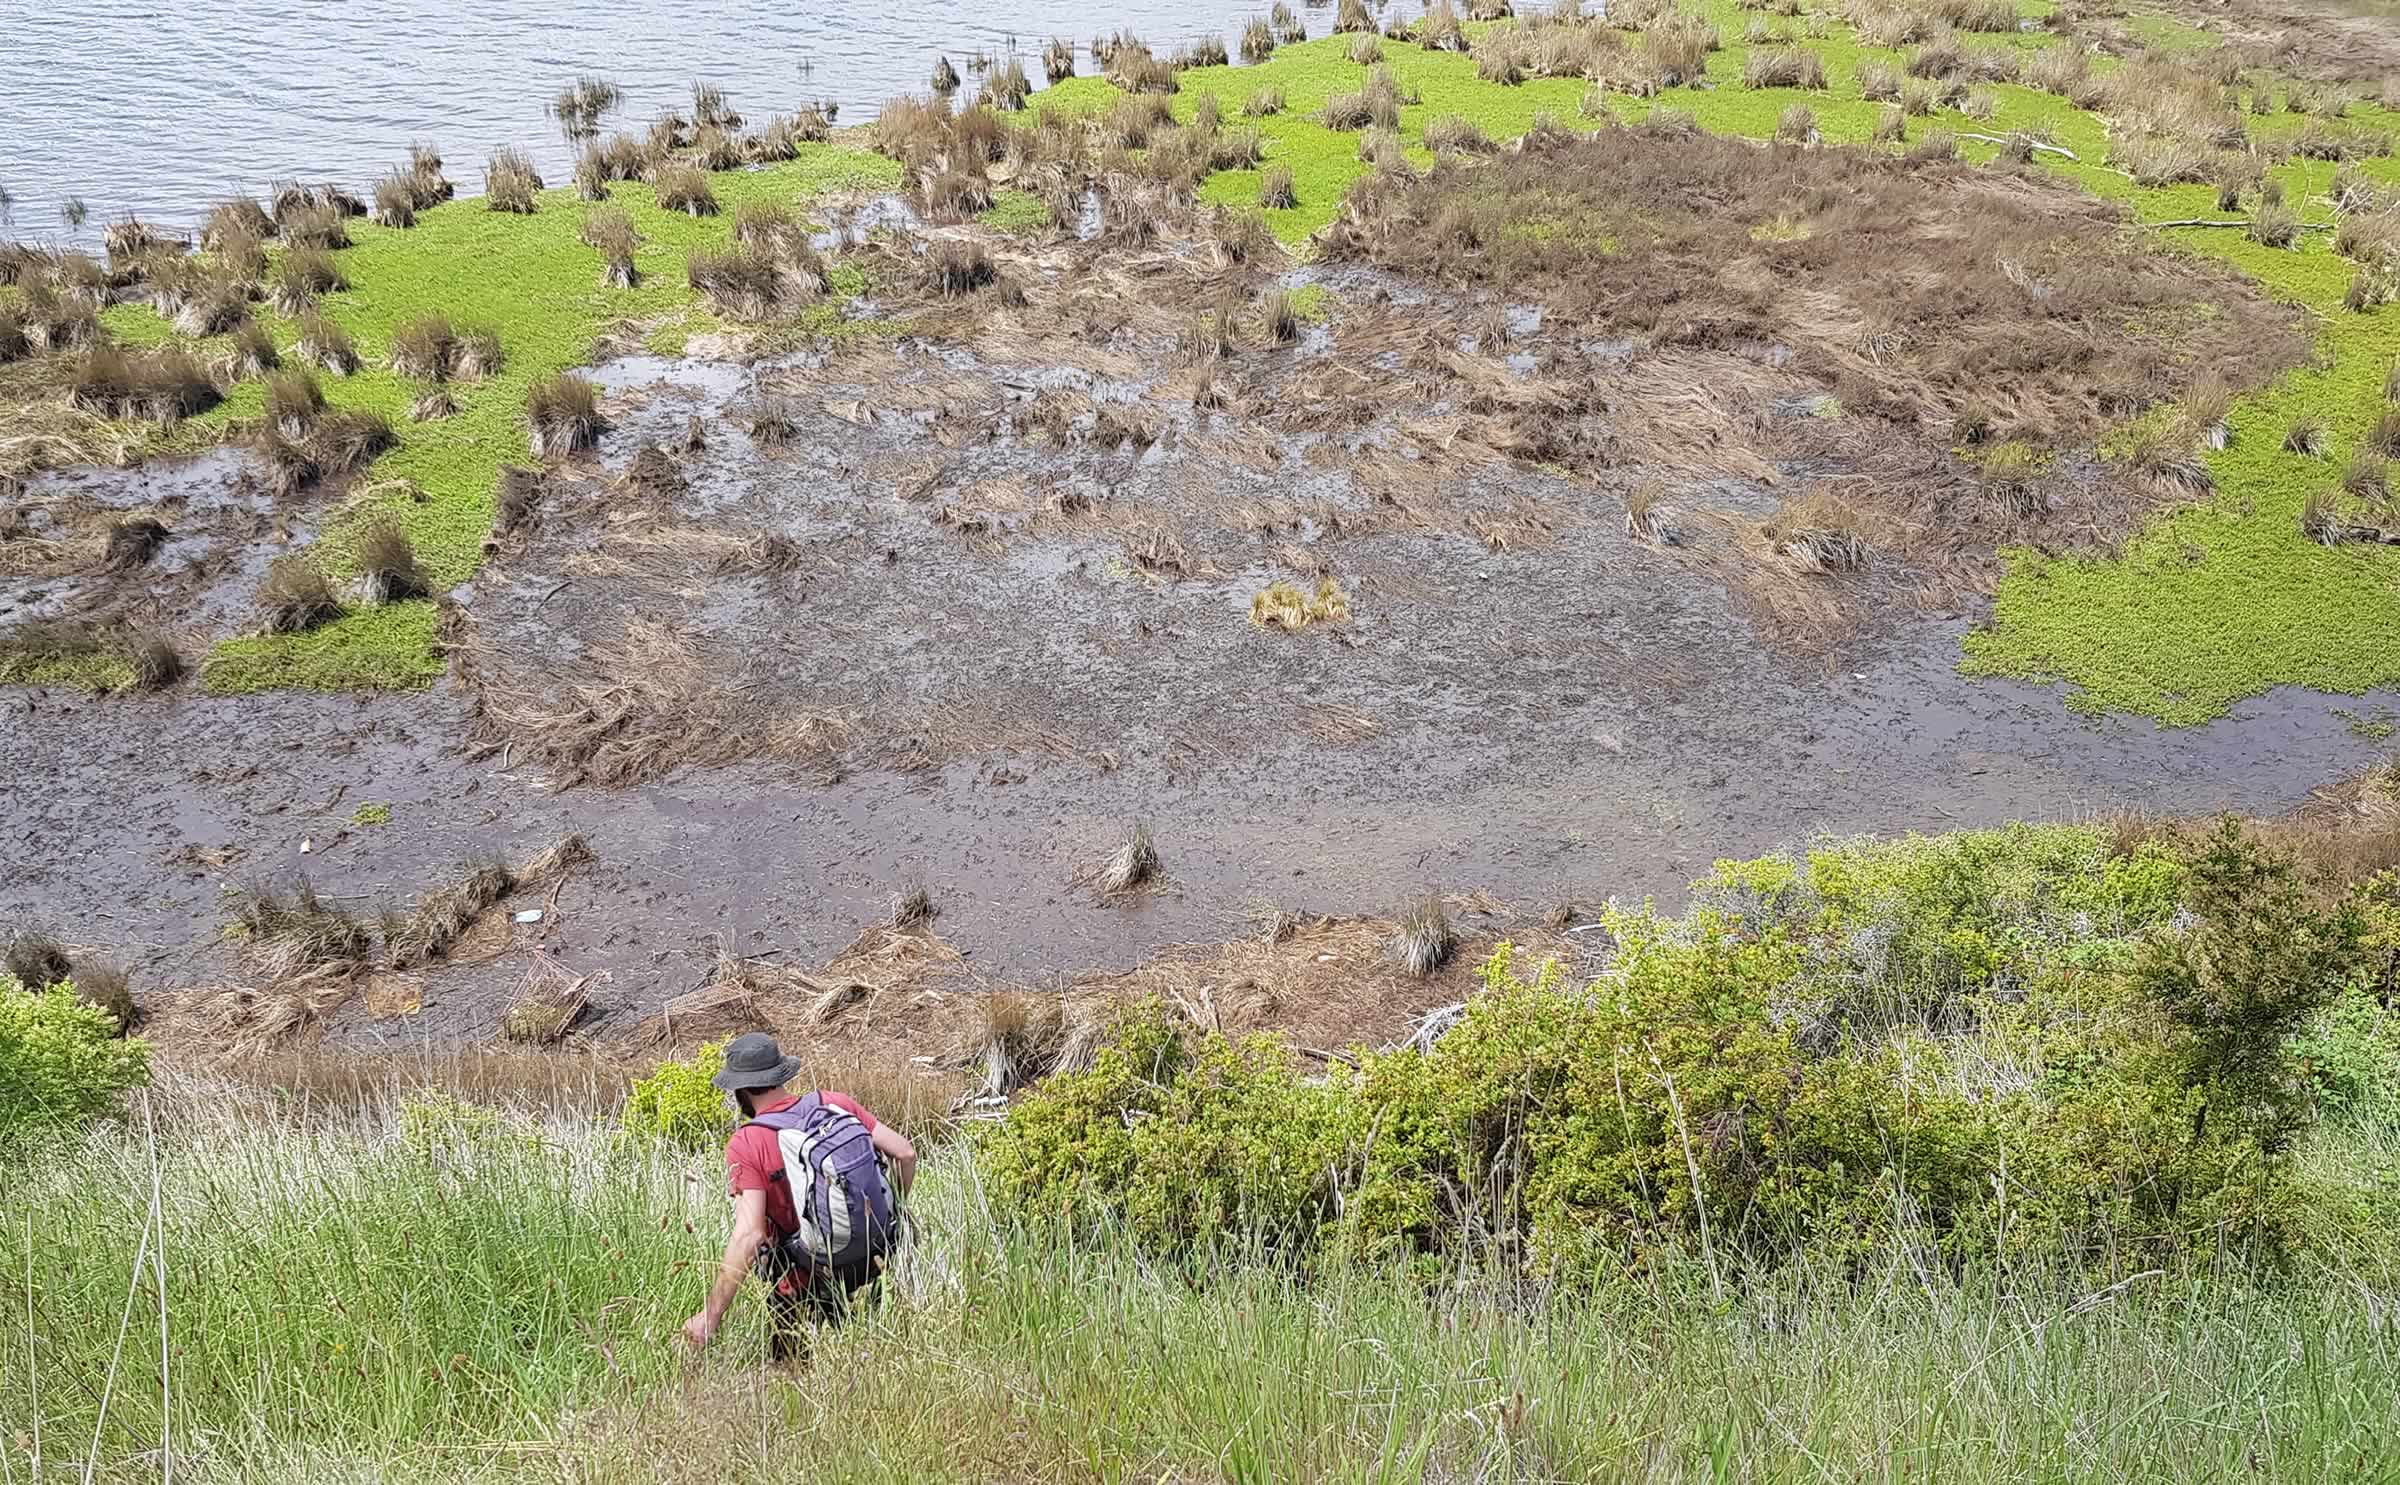
Rice grass — an invasive intertidal weed — has been successfully managed in the Derwent through annual surveys and control actions, and the area of infestation had been reduced from two hectares in 1995 to zero in 2009 and 2010. Surveys in 2015 found several small patches in the middle estuary region. These sites continue to be monitored and in 2017 and 2018 no rice grass was observed. A Derwent region weeds group has been established by the DEP with the aim of identifying emerging weed threats, sharing knowledge and resources. The rice grass survey also provides the opportunity to survey and inform land managers of other weeds infesting the mid-estuary.
Surveying the mid-estuary foreshore for rice grass and other weeds.
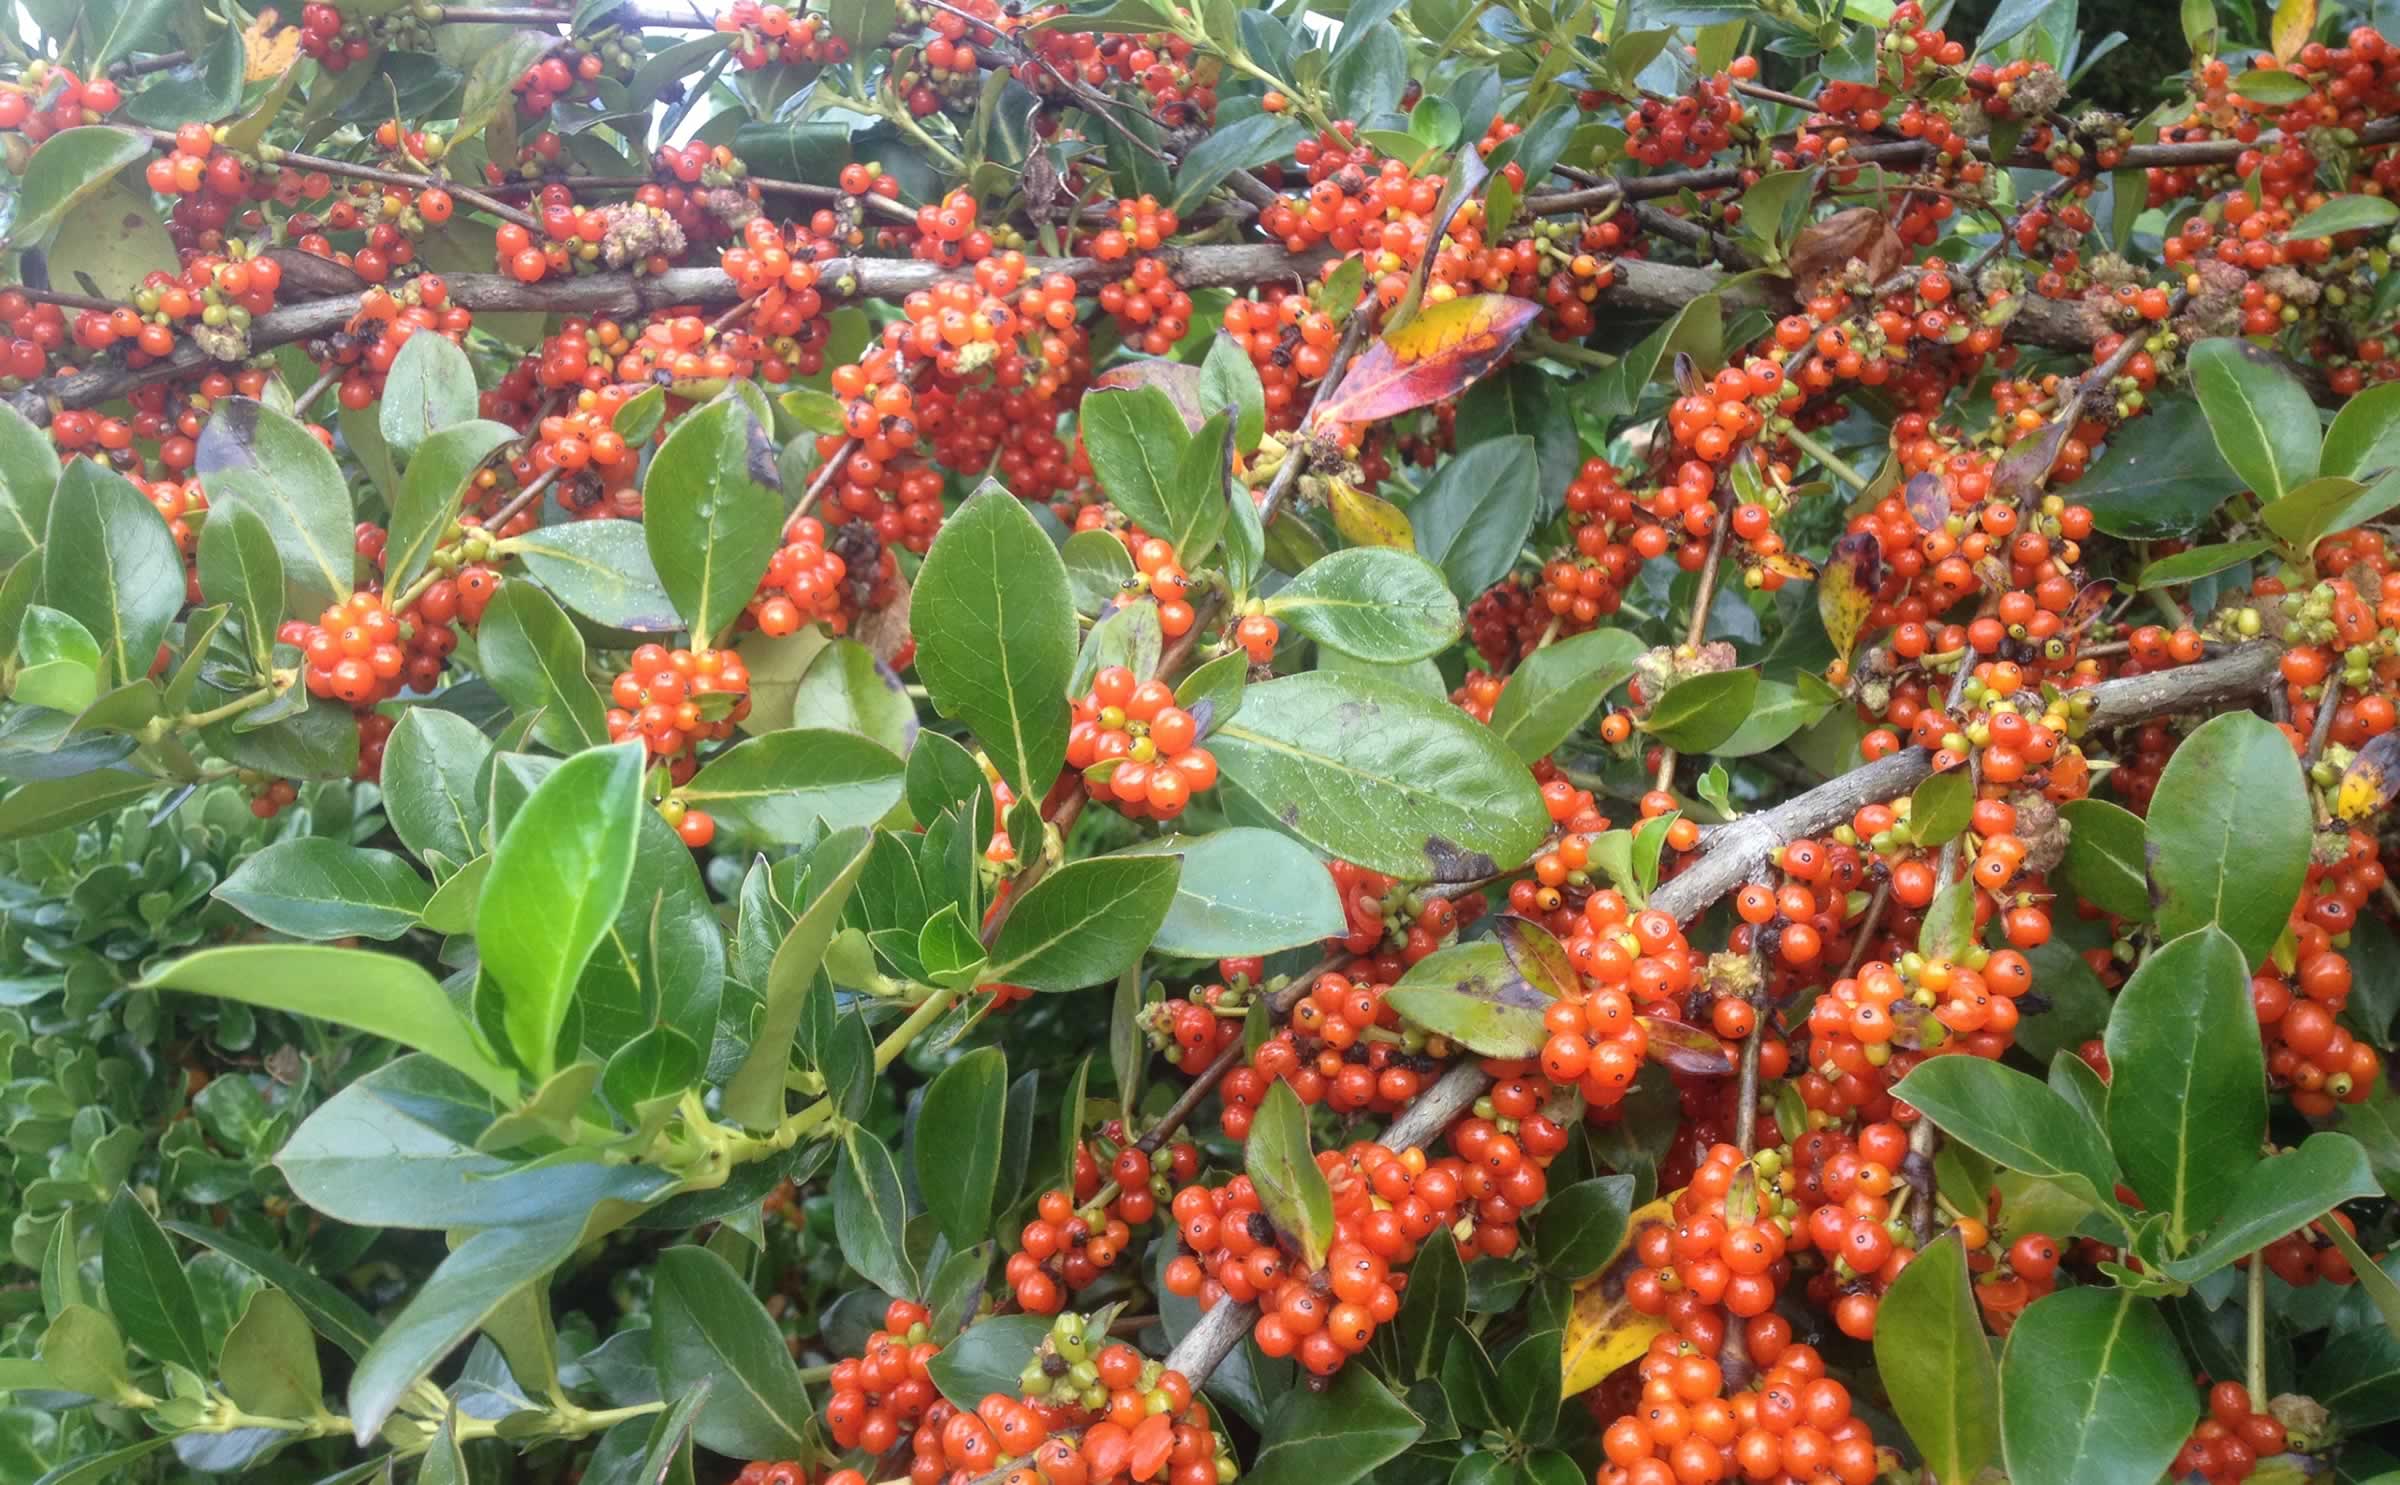
Karamu (Coprosma robusta) is an evergreen shrub originating from New Zealand that is a declared weed under the Tasmanian Weed Management Act 1999, requiring landholders to remove it from their property. The upper Derwent estuary had previously been identified as the largest infestation in Tasmania. While much has been eradicated over the past five years, a large dense infestation remains around New Norfolk. A winter boat survey confirmed the upper location of Karamu on the main trunk of the Derwent, starting at the riffles above Bryn Estyn. Primary control works were conducted by the Derwent Catchment Project on private land in and around New Norfolk following the survey. To guide the management of Karamu over the next 7 years a comprehensive management plan was developed by the stakeholders. Active and ongoing management of Karamu involves the Derwent Catchment Project, Department of State Growth, Parks and Wildlife Service, NRM South, DEP, Crown Land Services, and the Derwent Valley Council.
Did you know?
We are starting to see a decline in heavy metal levels in the water as well as in shellfish thanks to the interception of contaminated groundwater at Nyrstar.
The DEP Beach Watch and ambient water quality monitoring sites are located on the map along the location of waste water treatment plants and our industry partners Nyrstar and Norske Skog Boyer.
Use the “Explore map” button to find the Beach Watch and ambient water quality monitoring sites, the location and discharge rates of waste water treatment plants and large industry. The layers on the map can be viewed separately or together. Or view a list of the locations in the tables that follow.
Beach Watch water quality monitoring sites in 2017
The Derwent Estuary Program provides science to guide management. Here are several management examples highlighting how pollution has and is being, reduced in the Derwent estuary and catchment.
The Huon Aquaculture Meadowbank Facility located on the River Derwent slightly downstream of the Meadowbank Dam saw continuing reductions within its nutrient levels discharging into the River Derwent from its Aquaculture operations.
Between 2014 and 2018 there was a reduction in: total nitrogen (56%), combined ammonia and ammonium (76%), and total phosphorous (68%). These reductions are directly related to the immediate removal of solid waste from the flow utilising microstraining filters and the continued establishment of the onsite settlement dam and wetland. Flow meters measuring water inputs into the site were integrated with the site’s data system to allow for accurate development of mass loadings for these nutrients. This will allow site managers to better assess its actual impact and aim for continuous improvement of its discharging water quality moving forward.
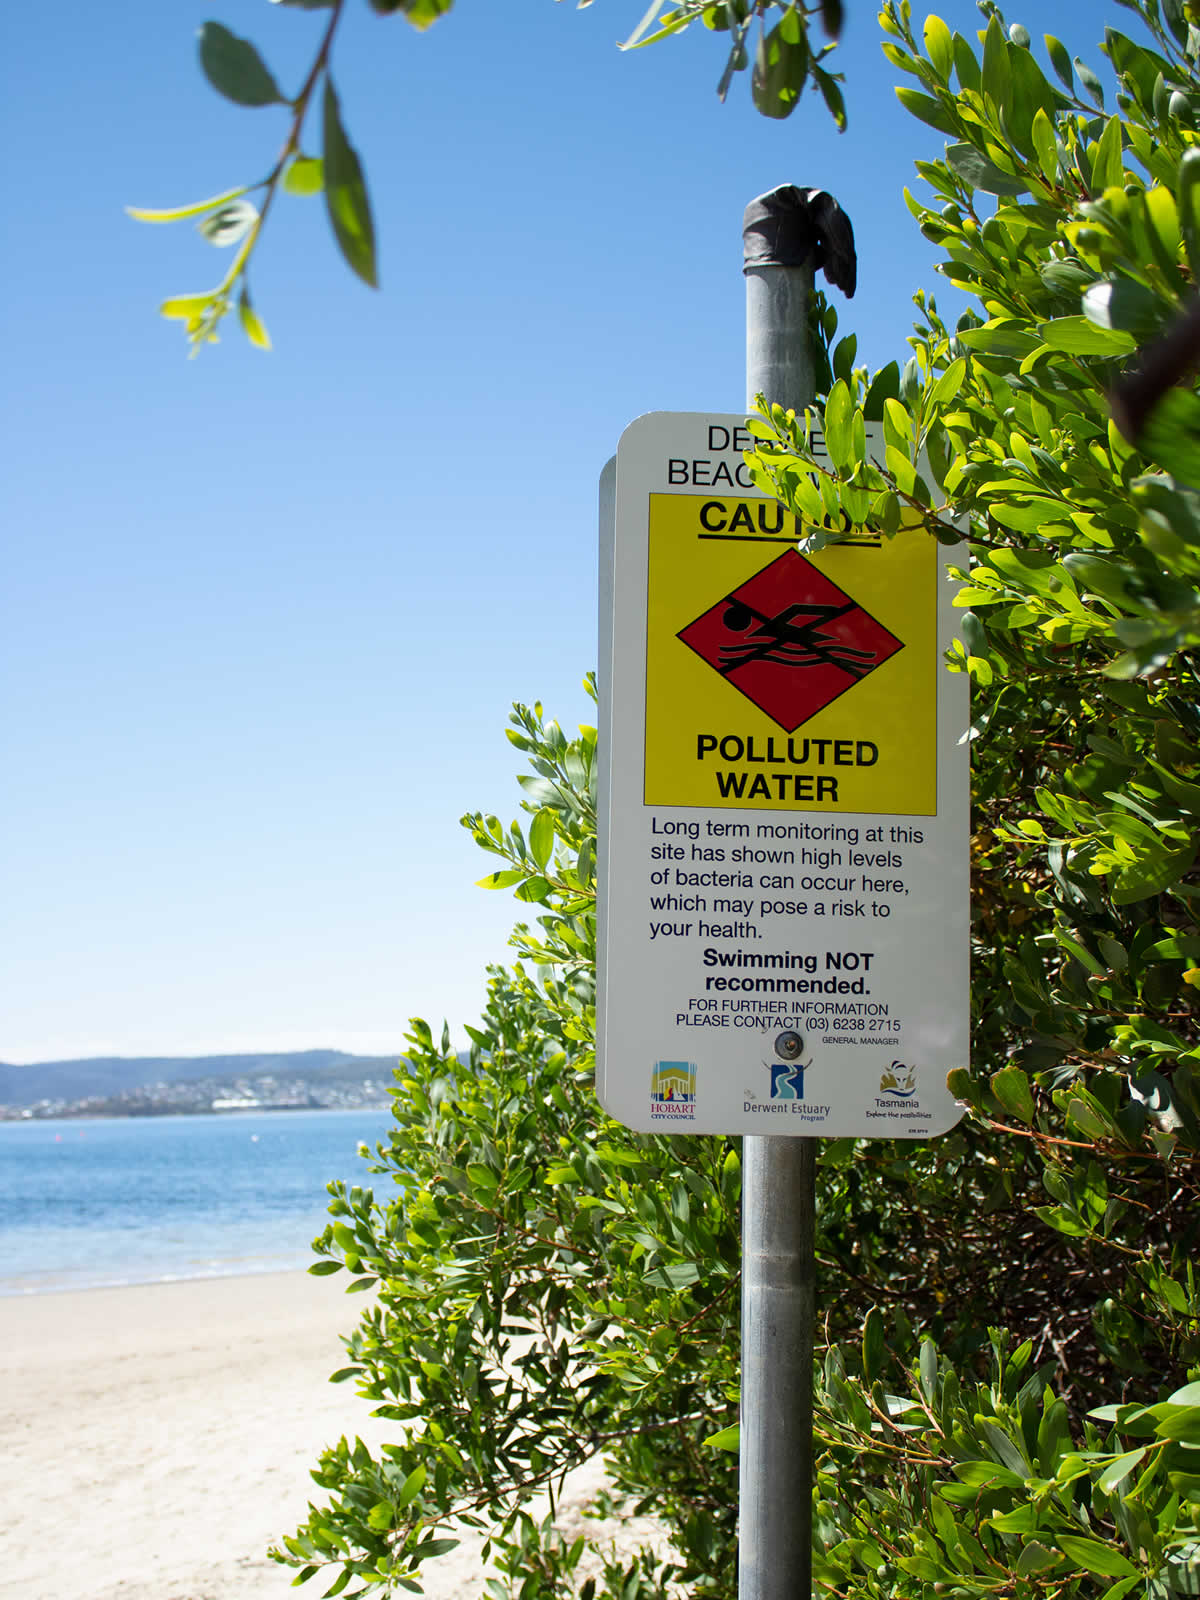
Finding and fixing the source stormwater pollution at Nutgrove Beach (west)
Current sign warning of poor water quality at Nutgrove beach (west) may soon be a thing of the past.
Image: Olivia Skeers
Last summer, a coordinated effort by City of Hobart, TasWater and DEP identified a cracked pipe and two cross-connections from sewer to stormwater reaching Nutgrove beach (west).
In the spring/summer of 2017–18, TasWater undertook significant repairs and sewer-pipe realignment and City of Hobart removed the direct cross-connections. Sampling throughout the 2017–18 season has shown that this coordinated effort has resulted in a marked improvement in the rolling 5-year results for enterococci levels (a faecal indicator bacteria) at Nutgrove Beach west, despite it remaining in the ‘poor’ category. It is hoped that results in the coming season continue to show reduced enterococci levels so the ‘no-swimming’ recommendation can be removed.
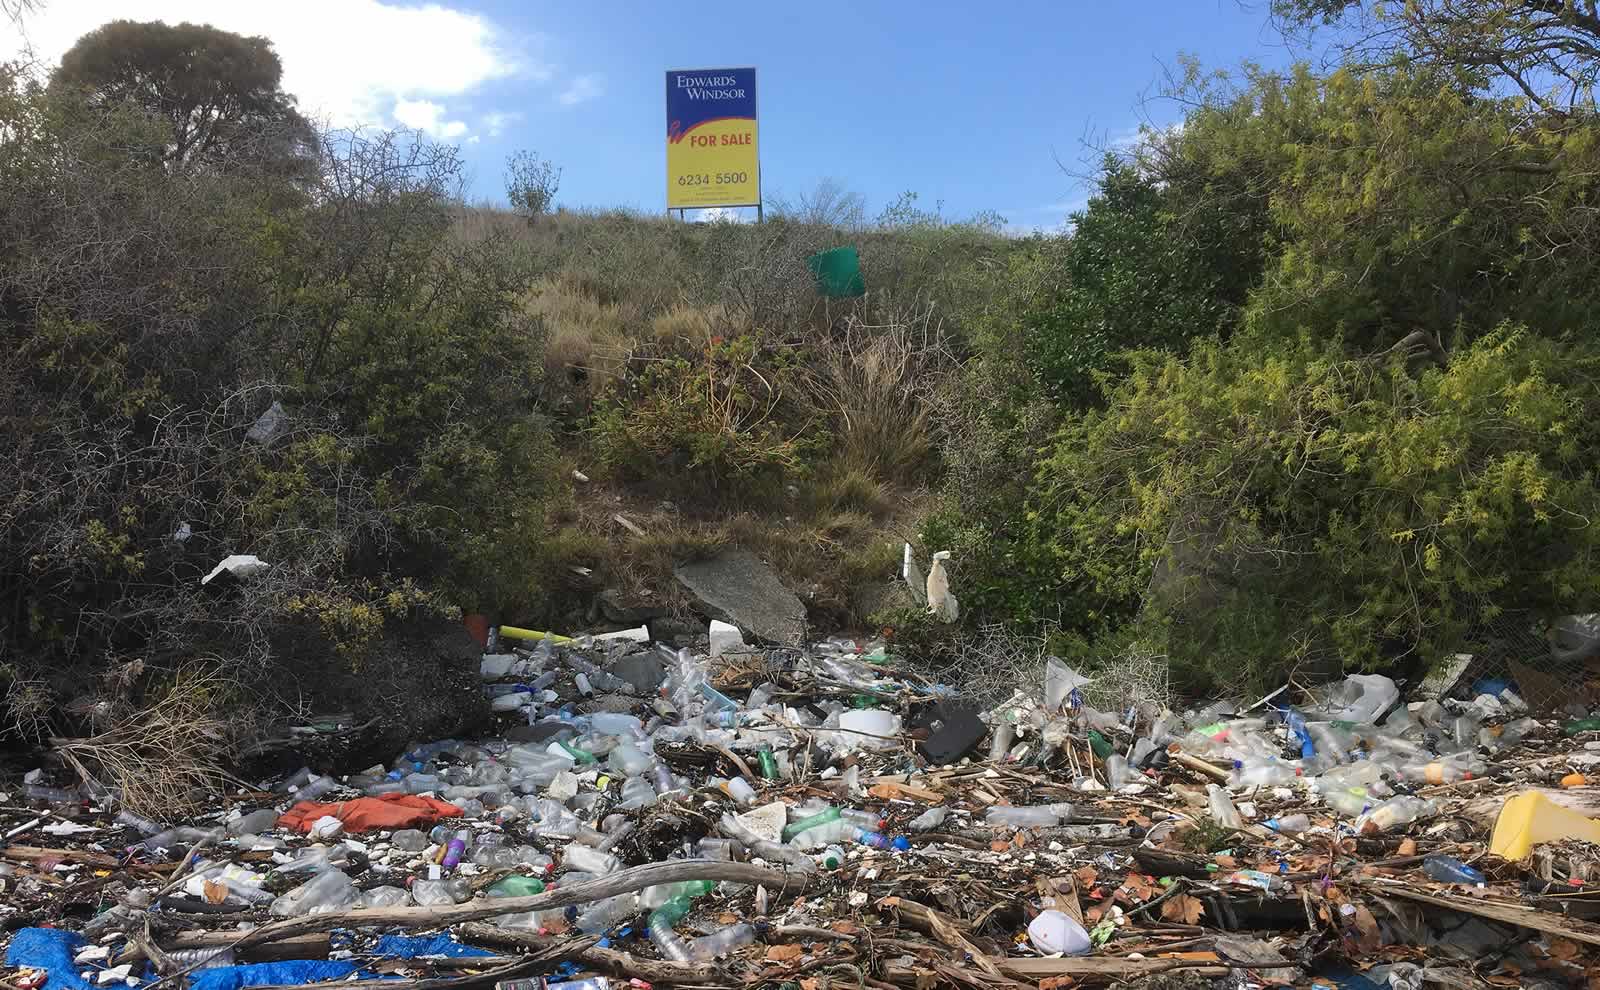
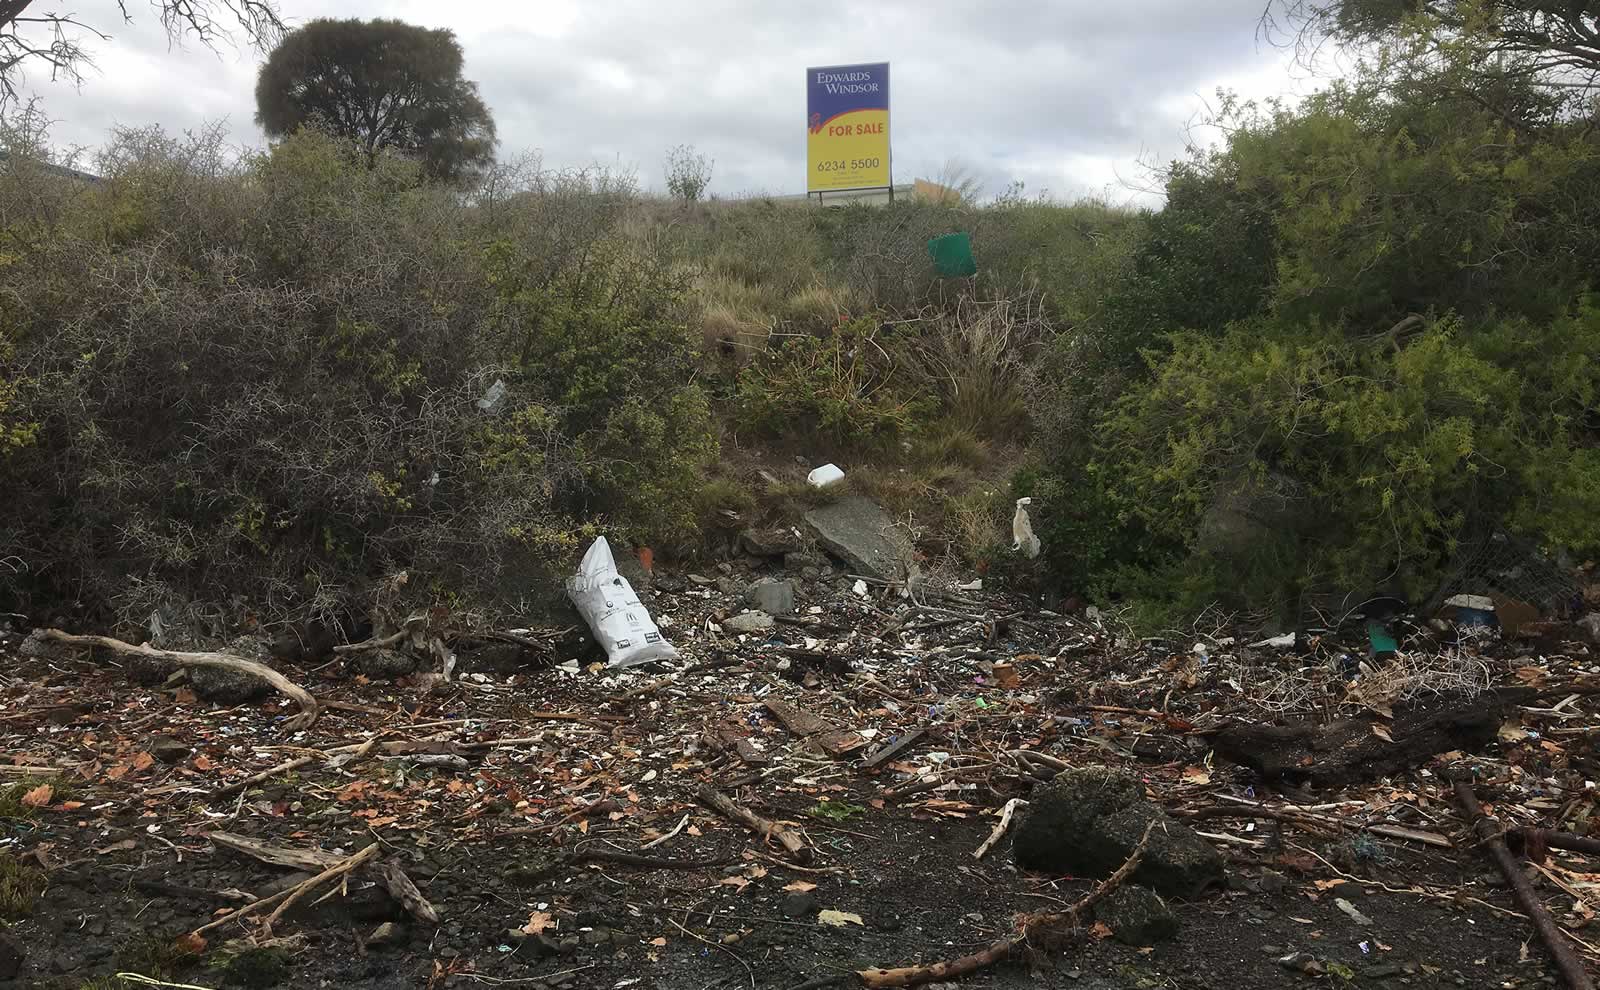
In 2018, the DEP coordinated two clean up events at Prince of Wales Bay. The first was a Business Clean Up Australia Day event which included a team of over 20 volunteers from DEP partners including Tas Water, Nyrstar and Glenorchy City Council. The team collected 80 bags of rubbish in three hours including larger items such as metal drums, boxes, building materials, pipes, crates, polystyrene and rope.
To finish the job the DEP coordinated a second clean up event, this time with volunteers from seven local business in Prince of Wales Bay. With improved access via the use of a boat on loan from the Plastic Fabrications Group, the team disposed of approximately 800kg of rubbish in four hours leaving the shoreline relatively clean. The two events were a success and encouraged networking across local businesses and council and raised awareness of a large-scale community issue.
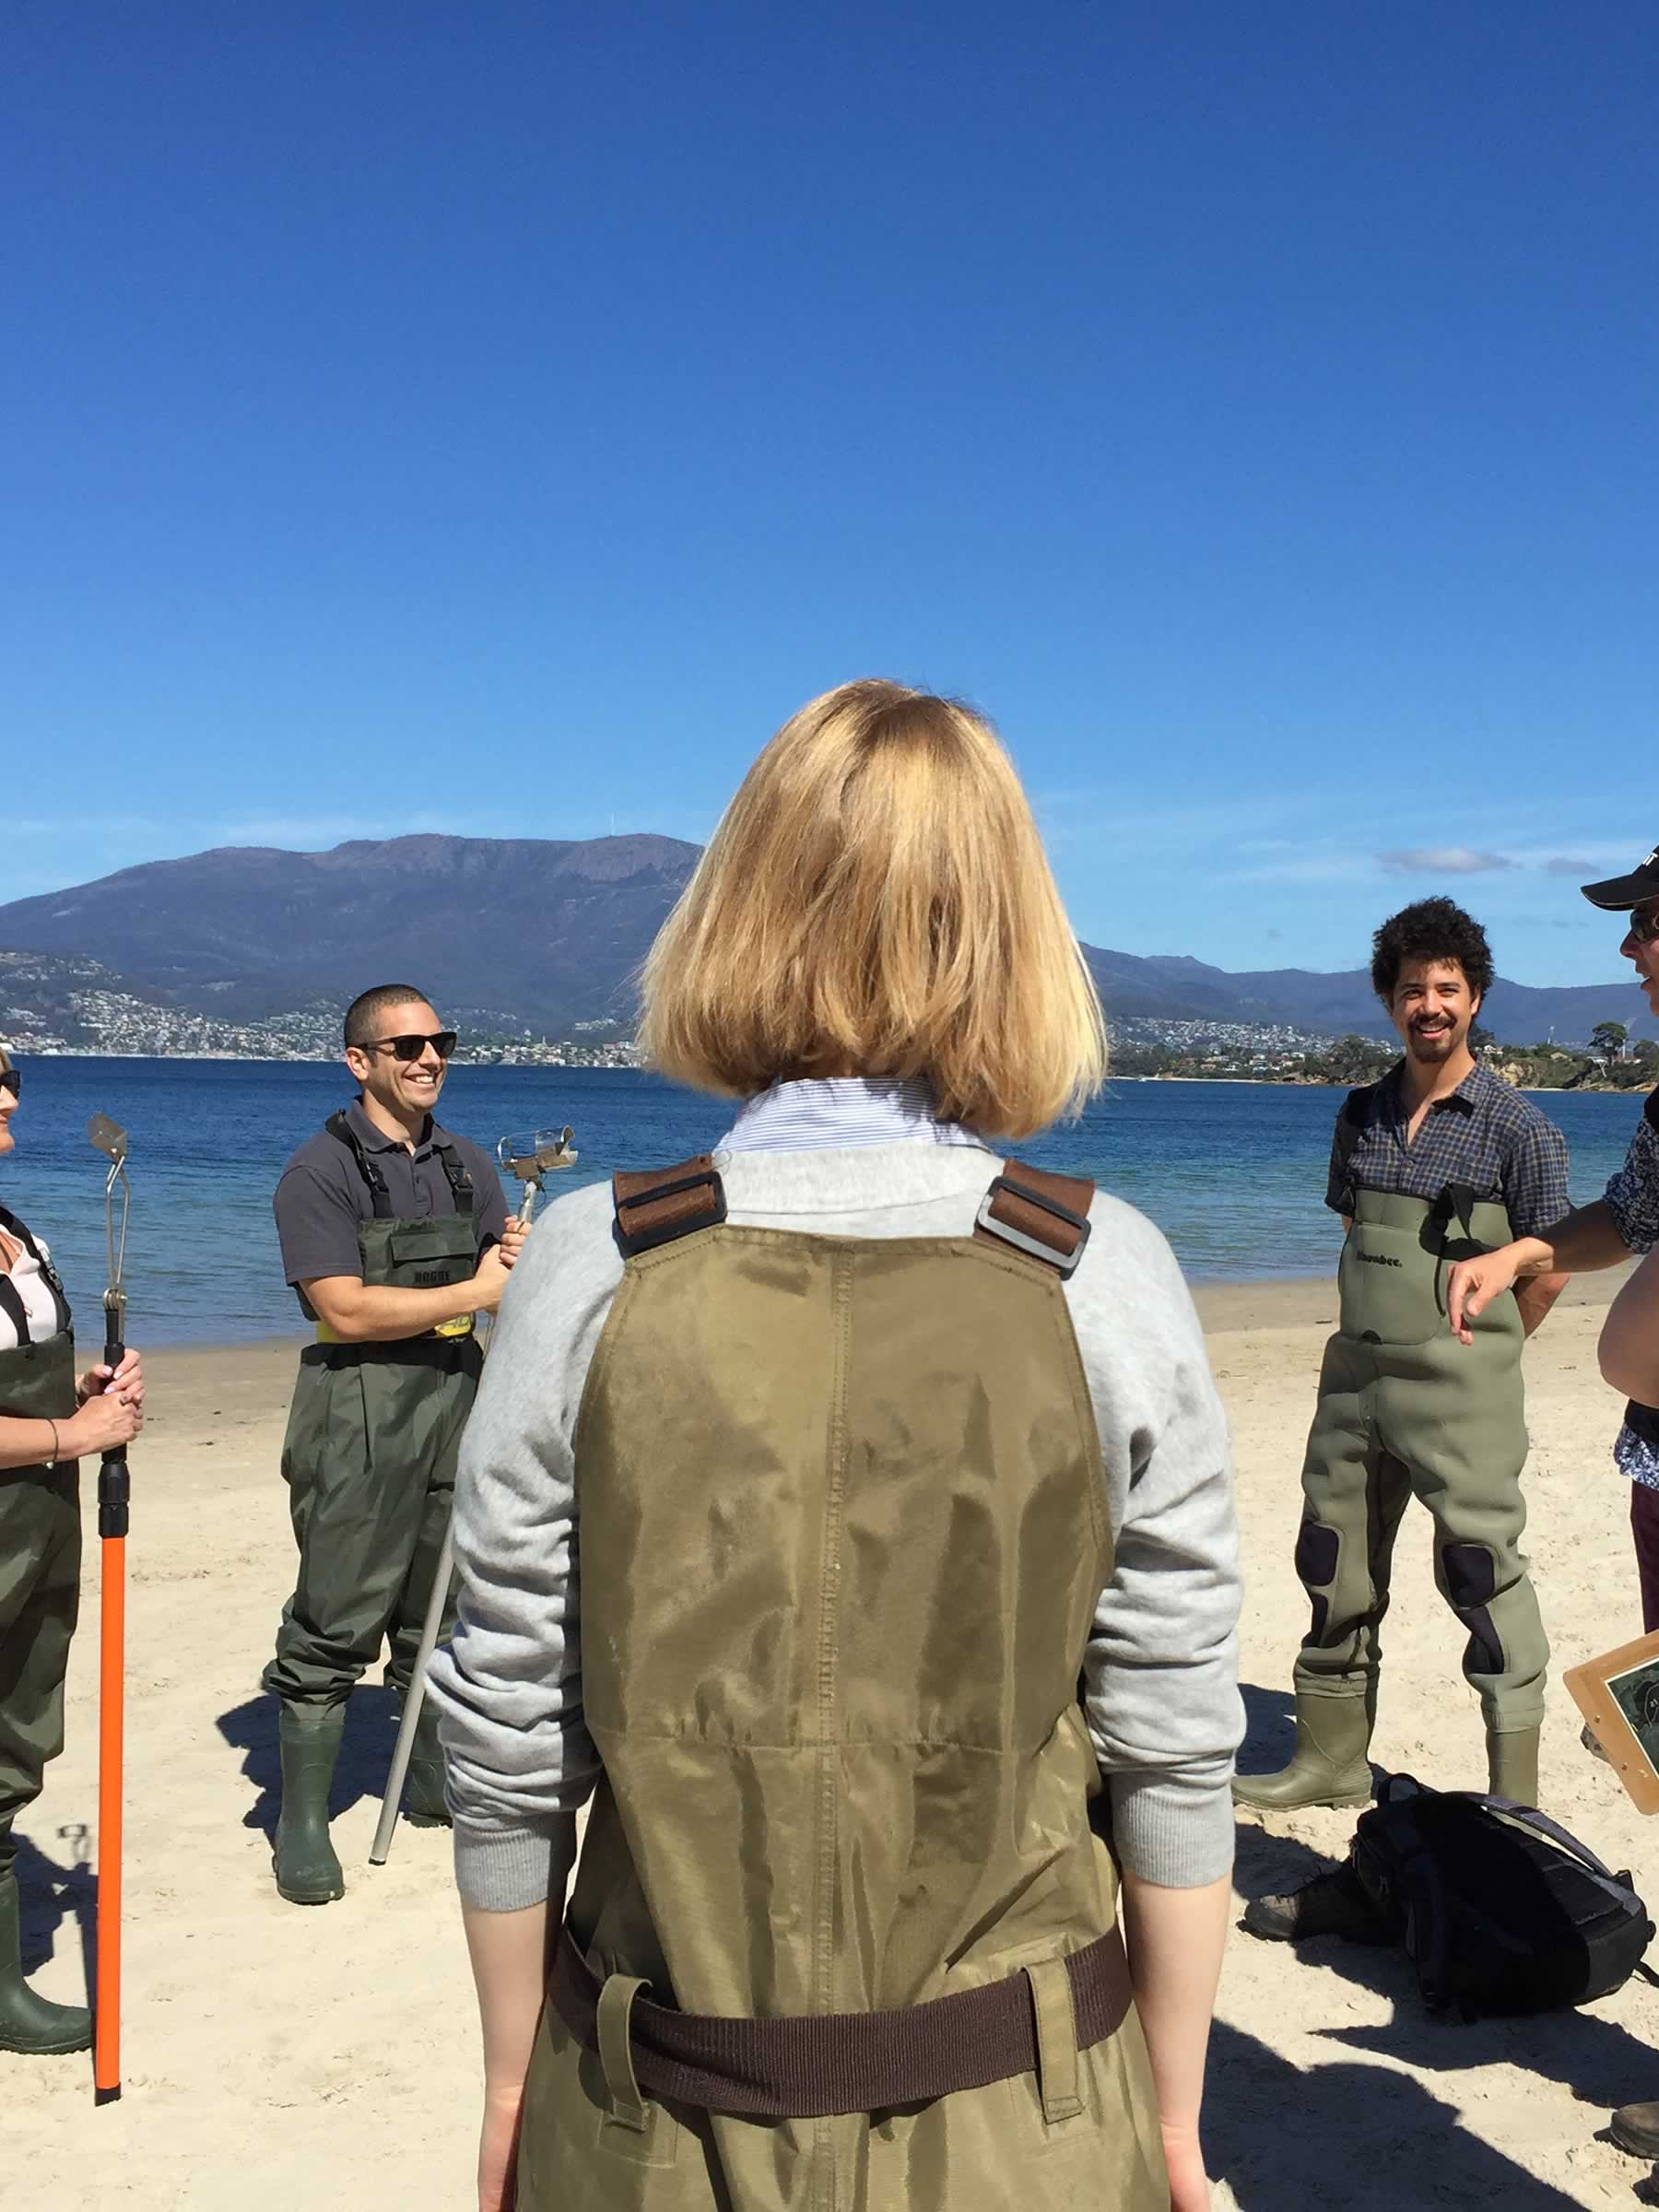
Annual Beach Watch inter-calibration exercise
Image: H. Bobbi, DHHS
Each year, in preparation for the summer beach water quality monitoring (Beach Watch), the DEP facilitates a training session for environmental health officers from our six council partners and members of the Department of Health and Human Services.
The session is held at one of our lovely local beaches to ensure that everybody is familiar with the required sampling techniques and handling requirements to guarantee consistency of results. Topics include common pitfalls to avoid contamination of the sample, how best to keep it cold until delivered to the Public Health Laboratory in New Town, how to fill in lab submission forms with climate data and general observations, and how to stay safe while sampling. Everybody brings their waders and sample rods, and sampling methods are reviewed and practiced together, followed by a comparison of results to confirm uniformity. It is also an opportune time to get together at the start of the summer swimming season for general support, and for ‘old hands’ to share their knowledge and experience with newcomers.
Little penguin monitoring has been given a boost with assistance from DPIPWE’s Land Tasmania, who have produced an Arc-GIS Collector App. The App enables efficient collection and reporting of little penguin data and instant access to the data by land managers.
Monitors are already using the App in the field and the consolidation of recent and historical monitoring data has occurred, with the invaluable help of an IMAS Honours student. This year also saw weeds controlled at a difficult to access little penguin site on the western shore of the Derwent, along with the addition of some new nest boxes thanks to the support of Kingborough Council. At the largest little penguin colony on the Derwent, volunteers from the Friends School undertook rubbish runs, marked all un-marked nest boxes, weeded and planted native vegetation which has helped improve the site.